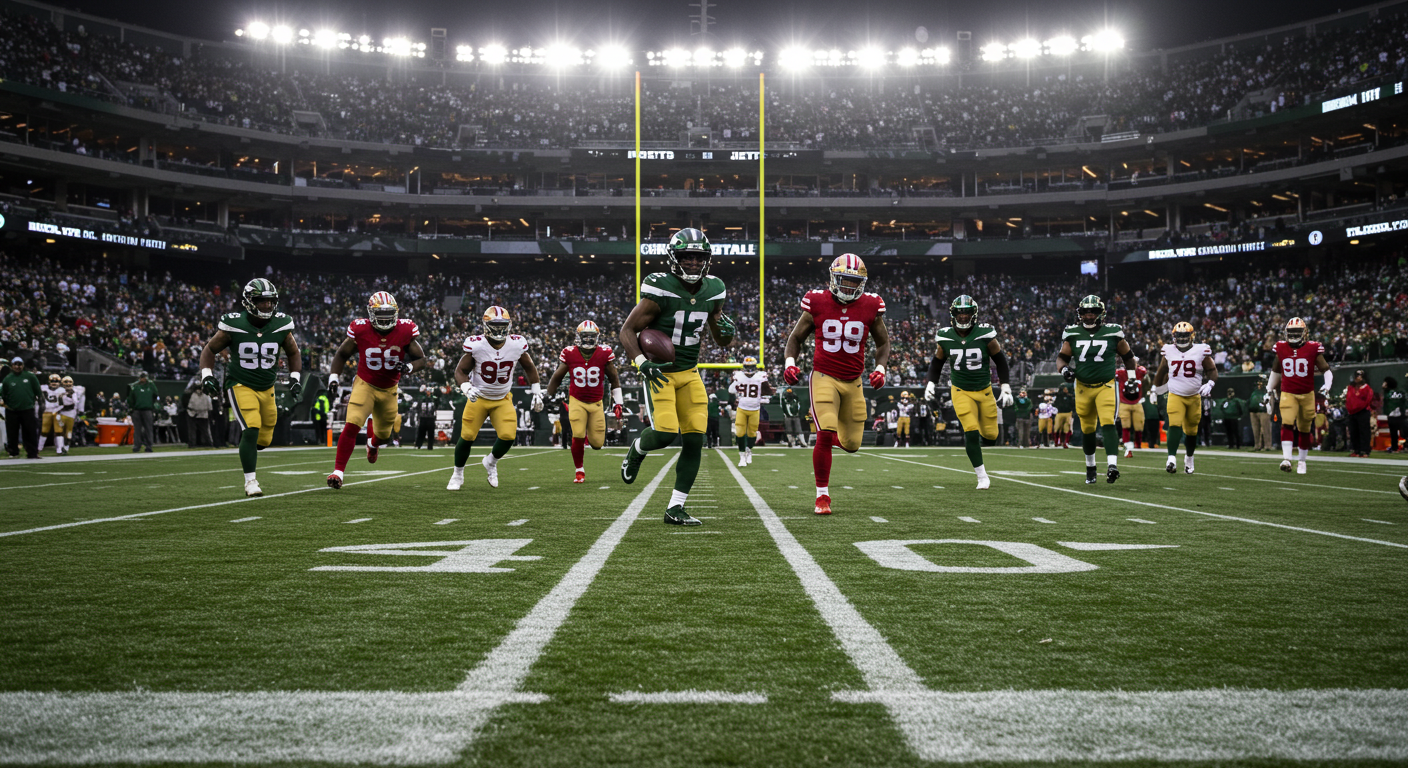
New York Jets vs 49ers Match Player Stats Revealed – 49ers Destroy Jets
The New York Jets vs 49ers match on Monday Night Football showcased San Francisco’s dominance while dampening expectations for Aaron Rodgers’ highly anticipated return to NFL action.
This primetime week 1 clash provided plenty of talking points, with several unexpected performers stealing the spotlight at Levi’s Stadium.
Game Overview: 49ers Control Every Aspect
The statistical dominance was clear from the official box score:
| Team Stats | 49ers | Jets |
|---|---|---|
| Final Score | 32 | 19 |
| Total Yards | 395 | 271 |
| Passing Yards | 231 | 203 |
| Rushing Yards | 164 | 68 |
| First Downs | 24 | 15 |
| Turnovers | 0 | 2 |
| Time of Possession | 38:40 | 21:20 |
| Penalties | 3 | 5 |
This Monday night showdown (September 9, 2024) at Levi’s Stadium achieved “Scorigami” status as the 1,085th unique final score in NFL history when Jets backup Tyrod Taylor found Allen Lazard for a late touchdown.
The game’s defining statistic was the overwhelmingly lopsided time of possession:
Time of Possession Breakdown:
- 49ers: 🕒🕒🕒🕒🕒🕒🕒🕒 (38:40)
- Jets: 🕒🕒🕒🕒 (21:20)
NFL records confirm this marked the lowest time of possession in any game throughout Aaron Rodgers’ professional career, highlighting just how thoroughly San Francisco controlled the game’s flow.
Quarterback Battle: Purdy’s Efficiency vs Rodgers’ Return
| QB Stats | Brock Purdy (SF) | Aaron Rodgers (NYJ) | Tyrod Taylor (NYJ) |
|---|---|---|---|
| Completions | 19/29 (65.5%) | 13/21 (61.9%) | 6/8 (75%) |
| Passing Yards | 231 | 167 | 36 |
| Touchdowns | 0 | 1 | 1 |
| Interceptions | 0 | 1 | 0 |
| Passer Rating | 89.9 | 82.8 | 114.6 |
| Rushing | 1 carry, 11 yards | 1 carry, -1 yard | 1 carry, 7 yards |
QB Performance Analysis:
Purdy overcame a slow start (2/6 for 20 yards in first quarter) to deliver consistent production throughout the remainder of the game. His ball distribution was excellent, connecting with five different receivers for 25+ yards each, and he avoided turnovers despite consistent pressure.
Rodgers displayed glimpses of his elite talent in his first meaningful action in 610 days. His highlight was a 36-yard touchdown strike to Allen Lazard on a free play after drawing the 49ers offsides. However, his interception to Flannigan-Fowles halted a promising drive at a critical moment.
Taylor entered late with the game decided, connecting with Lazard for the touchdown that created the historic “Scorigami” final score. His efficiency in limited action (75% completion rate) provided a solid backup performance.
Ground Game: Mason’s Career Day Carries 49ers
The running back battle became the pivotal storyline in this contest:
| Running Back Stats | Carries | Yards | Avg | TD | Receptions |
|---|---|---|---|---|---|
| Jordan Mason (SF) | 28 | 147 | 5.25 | 1 | 1 for 5 yds |
| Deebo Samuel (SF) | 8 | 23 | 2.9 | 1 | 5 for 54 yds |
| Breece Hall (NYJ) | 16 | 54 | 3.4 | 1 | 5 for 39 yds |
| Braelon Allen (NYJ) | 1 | 8 | 8.0 | 0 | 1 for 9 yds |
Rushing Effectiveness Comparison:
- 49ers: 5.25 yards per carry (Mason) ⭐⭐⭐⭐⭐
- Jets: 3.4 yards per carry (Hall) ⭐⭐⭐
Mason’s emergence as a legitimate NFL starting running back surprised observers who questioned the 49ers’ ability to replace injured Christian McCaffrey. The third-year undrafted free agent from Georgia Tech answered those questions emphatically with his career-best performance.
Key Rushing Stats:
- Mason surpassed his previous career high before halftime
- His 147 yards ranked second in NFL Week 1 rushing totals
- Mason’s 28 carries showed the coaching staff’s complete confidence
- Hall’s early fumble (forced by Warner, recovered by Collins) proved costly
The running game success continued a trend from the 49ers matchup against the Chiefs in Super Bowl LVIII, though this time San Francisco emerged victorious thanks to Mason’s relentless ground attack.
Receiving Corps: Balanced 49ers vs Jets’ Top Targets
| Top Receivers | Catches | Targets | Yards | TD | Yards/Rec |
|---|---|---|---|---|---|
| Allen Lazard (NYJ) | 6 | 9 | 89 | 2 | 14.8 |
| Jauan Jennings (SF) | 5 | 5 | 64 | 0 | 12.8 |
| Garrett Wilson (NYJ) | 6 | 11 | 60 | 0 | 10.0 |
| Deebo Samuel (SF) | 5 | 9 | 54 | 0 | 10.8 |
| George Kittle (SF) | 4 | 5 | 40 | 0 | 10.0 |
| Kyle Juszczyk (SF) | 2 | 3 | 40 | 0 | 20.0 |
| Breece Hall (NYJ) | 5 | 6 | 39 | 0 | 7.8 |
| Brandon Aiyuk (SF) | 2 | 5 | 28 | 0 | 14.0 |
Target Distribution Analysis:
The 49ers showcased their balanced offensive attack with five different receivers gaining 25+ yards. No San Francisco pass catcher was targeted more than 9 times, demonstrating Purdy’s willingness to distribute the ball based on defensive coverage.
The Jets relied heavily on two main targets:
- Wilson (11 targets, 54.5% completion rate)
- Lazard (9 targets, 66.7% completion rate)
Lazard proved to be the most efficient receiver on the field, scoring both Jets touchdowns and averaging 14.8 yards per reception. His connection with Rodgers, dating back to their Green Bay days, was evident throughout the game.
Juszczyk’s 40 yards on just 2 catches (20.0 yards per reception) highlighted the fullback’s versatility in Kyle Shanahan’s offense. Meanwhile, Brandon Aiyuk, despite a training camp holdout, contributed with 2 receptions for 28 yards.
Defence Stars: Warner and Adams Lead Standout Performances
| Defensive Leaders | Tackles (Solo) | Sacks | INT | FF | FR |
|---|---|---|---|---|---|
| Tony Adams (NYJ) | 12 (8) | 1.0 | 0 | 0 | 0 |
| Fred Warner (SF) | 7 (5) | 0.0 | 0 | 1 | 0 |
| C.J. Mosley (NYJ) | 9 (8) | 0.0 | 0 | 0 | 0 |
| D.J. Reed (NYJ) | 9 (7) | 0.0 | 0 | 0 | 0 |
| De’Vondre Campbell (SF) | 5 (2) | 0.0 | 0 | 0 | 0 |
| Maliek Collins (SF) | 2 (2) | 0.0 | 0 | 0 | 1 |
| Leonard Floyd (SF) | 2 (1) | 1.0 | 0 | 0 | 0 |
| D. Flannigan-Fowles (SF) | 1 (1) | 0.0 | 1 | 0 | 0 |
| Micheal Clemons (NYJ) | 2 (1) | 1.0 | 0 | 0 | 0 |
| Quinnen Williams (NYJ) | 6 (5) | 0.0 | 0 | 0 | 0 |
Key Defensive Performances:
The Jets’ defense was led by Tony Adams with 12 combined tackles and a sack, while C.J. Mosley and D.J. Reed each contributed 9 tackles. Despite their individual efforts, the unit struggled to get off the field, partly due to the absence of holdout edge rusher Haason Reddick.
For the 49ers, Fred Warner made his presence felt with 7 tackles and a crucial forced fumble on Breece Hall that led to an early field goal. Flannigan-Fowles recorded the game’s only interception, halting a Jets drive. Leonard Floyd registered San Francisco’s only sack of Rodgers.
Turnover Impact:
Warner forces Hall fumble → Recovered by Collins → 49ers FG (+3)
Flannigan-Fowles intercepts Rodgers → 49ers FG drive (+3)
The 49ers defensive front consistently pressured Rodgers throughout the game, reminiscent of their performance against the Vikings in their previous matchup against a NFC North team.
Special Teams Magic: Jake Moody’s Perfect Night
| Kicking Performance | FG | FGA | XP | XPA | Points |
|---|---|---|---|---|---|
| Jake Moody (SF) | 6 | 6 | 2 | 2 | 20 |
| Greg Zuerlein (NYJ) | 0 | 0 | 1 | 1 | 1 |
Moody’s Field Goal Distances:
Q1: ▪️▪️▪️▪️▪️ 46 yards ✓
Q2: ▪️▪️▪️▪️▪️▪️ 51 yards ✓
Q2: ▪️▪️▪️ 31 yards ✓
Q3: ▪️▪️▪️▪️▪️▪️ 53 yards ✓
Q4: ▪️▪️ 23 yards ✓
Q4: ▪️▪️▪️▪️ 42 yards ✓
Punting Stats:
| Punter | Punts | Yards | Average |
|---|---|---|---|
| Mitch Wishnowsky (SF) | 3 | 138 | 46.0 |
| Thomas Morstead (NYJ) | 4 | 171 | 42.8 |
Return Game:
- Xavier Gipson (NYJ): 3 kick returns, 19.0 yard average
- Ronnie Bell (SF): 3 kick returns, 21.3 yard average
Moody’s historic night tied a 49ers franchise record with six field goals. His 20 points accounted for 62.5% of San Francisco’s total scoring output, proving crucial as the offense stalled in the red zone multiple times.
The kicking game clearly favored San Francisco, with Moody’s range and accuracy providing reliable points throughout all four quarters. His perfect 6-for-6 performance included two kicks beyond 50 yards, demonstrating his exceptional reliability.
Why San Francisco Dominated: 4 Key Factors
After analyzing the comprehensive stats from the official NFL game report, four critical factors emerge that explain the 49ers’ commanding victory:
| Key Factor | 49ers | Jets | Advantage |
|---|---|---|---|
| Time of Possession | 38:40 | 21:20 | 49ers (+17:20) |
| Turnovers | 0 | 2 | 49ers (+2) |
| Rushing Yards | 164 | 68 | 49ers (+96) |
| Field Goal Points | 18 | 0 | 49ers (+18) |
1. Ball Control Masterclass
The 49ers’ nearly 2:1 time of possession advantage stemmed from their ability to sustain drives throughout the game. Their third down success was particularly notable:
49ers: 9/16 (56.3%)
Jets: 3/11 (27.3%)
This efficiency kept the Jets defense on the field for extended periods while limiting Rodgers’ opportunities to establish rhythm.
2. Turnover Differential Impact
The 49ers won the turnover battle 2-0, with each Jets mistake proving costly:
Warner forces Hall fumble → 49ers field goal (+3)
Flannigan-Fowles intercepts Rodgers → 49ers field goal (+3)
These momentum shifts gave San Francisco additional scoring opportunities that proved decisive in the final margin.
3. Ground Game Dominance
The rushing disparity showcased San Francisco’s physical superiority at the line of scrimmage:
49ers: 164 rushing yards on 37 attempts (4.4 avg)
Jets: 68 rushing yards on 18 attempts (3.8 avg)
Mason’s consistent production allowed the 49ers to control game tempo and keep their offense in manageable down-and-distance situations.
4. Moody’s Perfect Night
Jake Moody’s flawless kicking performance provided reliable scoring when drives stalled:
Moody: 6/6 FG, 2/2 XP (20 points)
Zuerlein: 0/0 FG, 1/1 XP (1 point)
His field goals from various distances, including two from beyond 50 yards, ensured the 49ers capitalized on their scoring chances.
The victory improved San Francisco’s all-time record against the Jets to 12-3 in regular season matchups, reinforcing a historical pattern of success in this cross-conference rivalry.
FAQs About the New York Jets vs 49ers Match Player Stats
Who replaced Christian McCaffrey for the 49ers and how did he perform?
Jordan Mason stepped in with 147 rushing yards and a touchdown on 28 carries. His 5.25 yards per carry average demonstrated the 49ers’ ability to maintain their dominant ground game even without their All-Pro running back. Mason’s previous career high was 69 yards, making this performance a true breakthrough moment.
What was Aaron Rodgers’ highlight play in his return game?
Rodgers went 13/21 for 167 yards with 1 TD and 1 INT in his first meaningful action in 610 days. His highlight was a 36-yard touchdown strike to Allen Lazard on a free play after drawing the 49ers offsides. This perfectly placed deep ball to the back corner of the end zone demonstrated his arm talent remains intact despite the long layoff.
Why did the game earn “Scorigami” status and what does that mean?
The final score of 32-19 became the 1,085th unique final score in NFL history, known as a “Scorigami.” This occurred when Tyrod Taylor connected with Allen Lazard for a touchdown with just seconds remaining, followed by a successful extra point. Scorigami tracks the occurrence of score combinations that have never happened before in NFL history.
What contributed to the 49ers’ dominance in time of possession?
The 49ers controlled the clock through their efficient running game (4.4 yards per carry as a team) and third down success. They converted 9 of 16 third downs (56%) compared to the Jets’ 3 of 11 (27%), allowing them to sustain drives and keep their defense fresh while limiting Rodgers’ opportunities.
How did Jake Moody’s kicking performance compare historically?
Moody tied a 49ers franchise record with six field goals made (from distances of 46, 51, 31, 53, 23, and 42 yards) while converting both extra point attempts. His 20 points accounted for 62.5% of San Francisco’s total. This perfect 6/6 performance provided reliable scoring throughout the game.
Who were the leading receivers for each team?
Allen Lazard led the Jets with 6 catches for 89 yards and 2 touchdowns on 9 targets. For the 49ers, Jauan Jennings topped the receiving charts with 5 catches for 64 yards on 5 targets, followed by Deebo Samuel with 5 receptions for 54 yards on 9 targets.
Conclusion: Complete Team Victory for San Francisco
The New York Jets vs 49ers match player stats tell a compelling story of a team firing on all cylinders against a squad with much-hyped expectations. When examining the numbers closely, several conclusions become unmistakable:
- System Over Stars: The 49ers proved their offensive system can thrive even without Christian McCaffrey, with Mason stepping up magnificently.
- Trenches Decide Games: San Francisco’s dominance on both offensive and defensive lines dictated the outcome, allowing them to control the clock and game flow.
- Complementary Football: Each phase complemented the others perfectly – the offense sustained drives, the defense created turnovers, and special teams provided reliable scoring.
- Rodgers’ Work Ahead: While showing flashes of brilliance, Rodgers clearly needs time to rebuild chemistry with his receivers and adjust to game speed.
According to the official NFL game report, Jets head coach Robert Saleh acknowledged the gap between the teams: “That’s a championship outfit, and they introduced us to some championship football.”
For the 49ers, this opening week statement suggests they remain serious Super Bowl contenders even with key injuries. For the Jets, Rodgers’ return showed promise, but substantial improvement is needed to match their preseason hype.
The full statistical breakdown of this New York Jets vs 49ers match shows that beyond individual performances, football ultimately rewards the more complete team – and on this Monday night, that was unquestionably San Francisco.