Detroit Lions vs Arizona Cardinals Match Player Stats (Sep 22, 2024)
Quick Stats Summary
- Final Score: Detroit Lions 20, Arizona Cardinals 13
- Date: September 22, 2024
- Location: State Farm Stadium, Glendale, AZ
- Attendance: 63,650
- Key Performers: Jared Goff (18/23, 199 yards, 2 TD), David Montgomery (23 carries, 105 yards, 1 TD), Kyler Murray (21/34, 207 yards, 1 TD)
The Lions controlled this Week 3 matchup from start to finish, holding the ball for nearly 37 minutes while limiting Arizona to just three points after halftime.
Table of Contents
Scoring Summary by Quarter
| Quarter | Detroit | Arizona | Scoring Plays |
|---|---|---|---|
| 1st | 7 | 7 | Montgomery 1-yd TD run (10:16) / Harrison Jr. 10-yd TD rec (5:08) |
| 2nd | 13 | 3 | St. Brown 5-yd TD rec (12:27) / Gibbs 21-yd TD rec (0:36) / Prater 42-yd FG (0:00) |
| 3rd | 0 | 0 | No scoring |
| 4th | 0 | 3 | Prater 45-yd FG (3:52) |
Arizona managed just 53 offensive plays compared to Detroit’s 68. The Lions’ opening drive set the tone: 9 plays, 70 yards, 4:44 off the clock, capped by Montgomery’s touchdown.
Detroit Lions Offensive Statistics
Passing Game
| Player | Comp/Att | Yards | TD | INT | Rating | Sacks |
|---|---|---|---|---|---|---|
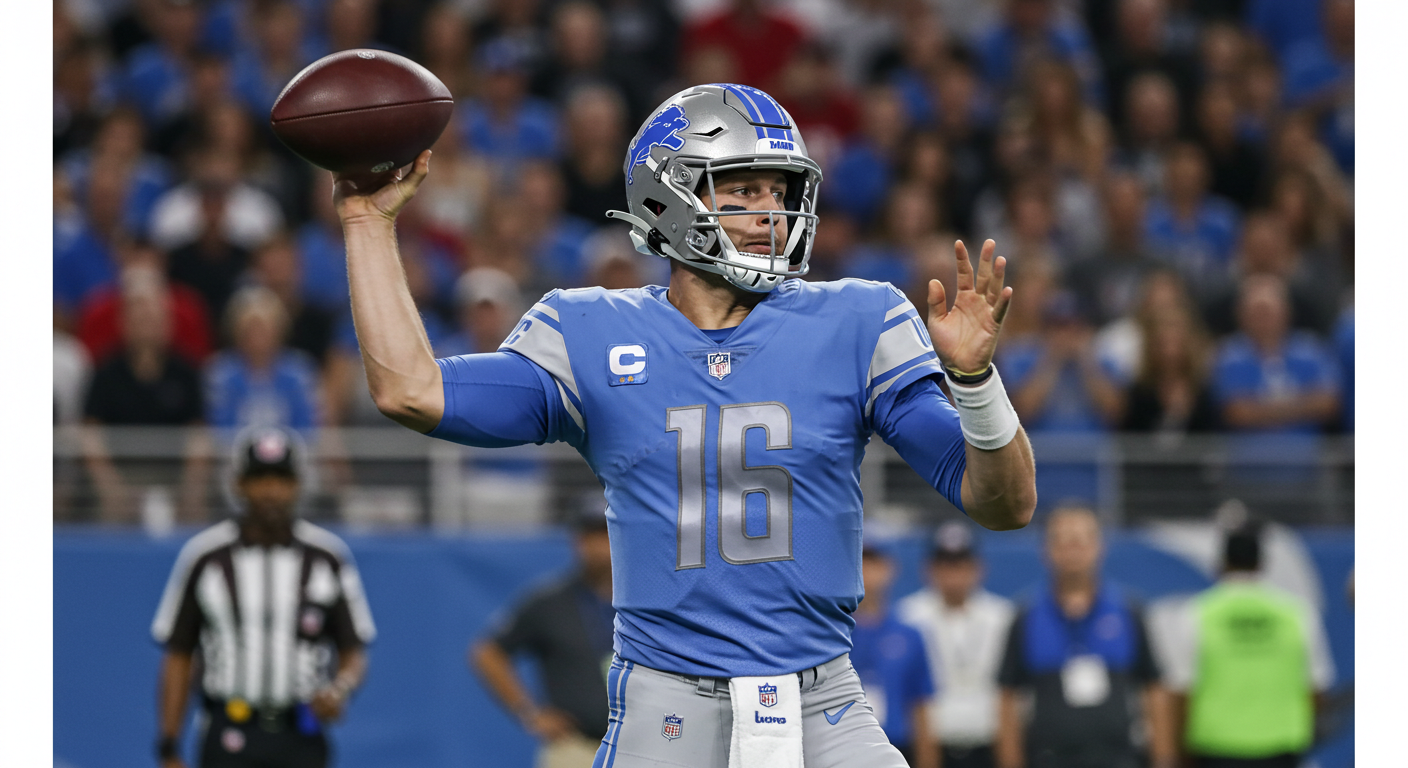
| Jared Goff | 18/23 | 199 | 2 | 1 | 113.6 | 2-13 |
Goff’s start was historic for his career. He completed his first 14 passes, going 12 for 12 in the first half with 137 yards and both touchdown passes. His only incompletion before halftime came on a throwaway.
Rushing Attack
| Player | Carries | Yards | Avg | TD | Long |
|---|---|---|---|---|---|
| David Montgomery | 23 | 105 | 4.6 | 1 | 16 |
| Jahmyr Gibbs | 16 | 83 | 5.2 | 0 | 18 |
| Jared Goff | 3 | 6 | 2.0 | 0 | 8 |
| Jameson Williams | 1 | -7 | -7.0 | 0 | -7 |
| Team Total | 43 | 187 | 4.3 | 1 | 18 |
Montgomery carried six times for 39 yards on the opening touchdown drive alone. The Lions’ 43 rushing attempts kept Arizona’s defense on the field and wore them down as the game progressed.
Receiving Corps
| Player | Rec | Yards | Avg | TD | Targets | Long |
|---|---|---|---|---|---|---|
| Amon-Ra St. Brown | 7 | 75 | 10.7 | 1 | 8 | 20 |
| Sam LaPorta | 2 | 36 | 18.0 | 0 | 2 | 24 |
| Brock Wright | 4 | 34 | 8.5 | 0 | 5 | 11 |
| Jahmyr Gibbs | 0 | 20 | — | 1 | 0 | 20 |
| David Montgomery | 3 | 17 | 5.7 | 0 | 3 | 9 |
| Jameson Williams | 1 | 9 | 9.0 | 0 | 3 | 9 |
| Tim Patrick | 1 | 8 | 8.0 | 0 | 1 | 8 |
The Gibbs touchdown came on the hook-and-ladder play. St. Brown caught the pass and immediately pitched to Gibbs, who raced 21 yards to the end zone. Jake Bates missed the extra point after St. Brown’s touchdown, his only miss of three attempts.
Arizona Cardinals Offensive Statistics
Passing Game
| Player | Comp/Att | Yards | TD | INT | Rating | Sacks |
|---|---|---|---|---|---|---|
| Kyler Murray | 21/34 | 207 | 1 | 1 | 76.5 | 1-7 |
Murray faced constant pressure despite taking just one official sack. He completed passes to eight different receivers but couldn’t sustain drives. His interception came in the end zone early in the third quarter.
Rushing Attack
| Player | Carries | Yards | Avg | TD | Long |
|---|---|---|---|---|---|
| Kyler Murray | 5 | 45 | 9.0 | 0 | 21 |
| James Conner | 9 | 17 | 1.9 | 0 | 7 |
| Trey Benson | 2 | 8 | 4.0 | 0 | 6 |
| Emari Demercado | 2 | 7 | 3.5 | 0 | 6 |
| Team Total | 18 | 77 | 4.3 | 0 | 21 |
Conner’s struggles defined Arizona’s offensive limitations. Without an effective running game, Murray shouldered 91% of the team’s total offensive production (252 of 277 yards).
Receiving Corps
| Player | Rec | Yards | Avg | TD | Targets | Long |
|---|---|---|---|---|---|---|
| Michael Wilson | 8 | 64 | 8.0 | 0 | 9 | 28 |
| Marvin Harrison Jr. | 5 | 64 | 12.8 | 1 | 11 | 17 |
| Greg Dortch | 3 | 35 | 11.7 | 0 | 6 | 13 |
| Trey McBride | 3 | 25 | 8.3 | 0 | 6 | 9 |
| Elijah Higgins | 1 | 11 | 11.0 | 0 | 1 | 11 |
| James Conner | 1 | 8 | 8.0 | 0 | 1 | 8 |
Harrison Jr.’s touchdown came from 10 yards out at 5:08 of the first quarter, Arizona’s only trip to the end zone all game.
Defensive Performances
Detroit Lions Defense
| Player | Tackles (Total/Solo) | TFL | Sacks | QB Hits | Pass Def | INT |
|---|---|---|---|---|---|---|
| Brian Branch | 9/6 | 1 | 0 | 0 | 2 | 0 |
| Carlton Davis III | 7/7 | 1 | 0 | 0 | 0 | 0 |
| Aidan Hutchinson | 6/4 | 1 | 1 | 2 | 0 | 0 |
| Malcolm Rodriguez | 5/1 | 0 | 0 | 0 | 0 | 0 |
| Jack Campbell | 4/2 | 0 | 0 | 0 | 0 | 0 |
| Kerby Joseph | 3/1 | 0 | 0 | 0 | 2 | 1 |
| Mekhi Wingo | 3/1 | 0 | 0 | 0 | 0 | 0 |
| Terrion Arnold | 2/2 | 0 | 0 | 0 | 2 | 0 |
| Amik Robertson | 2/2 | 0 | 0 | 0 | 0 | 0 |
| Ben Niemann | 2/1 | 0 | 0 | 0 | 0 | 0 |
| DJ Reader | 1/0 | 0 | 0 | 2 | 0 | 0 |
| Levi Onwuzurike | 1/0 | 0 | 0 | 2 | 0 | 0 |
| Team Total | 49/31 | 3 | 1 | 4 | 6 | 1 |
Hutchinson’s sack came for a 7-yard loss, pushing his season total to 6.5 in three games. Joseph’s interception in the end zone marked his 10th career pick and second this season.
Rodriguez and Campbell stepped up after Derrick Barnes left with a knee injury in the first half. Barnes recorded one tackle before exiting. Dan Skipper also left briefly but returned.
Arizona Cardinals Defense
| Player | Tackles (Total/Solo) | TFL | Sacks | QB Hits | Pass Def | INT |
|---|---|---|---|---|---|---|
| Kyzir White | 11/1 | 0 | 0 | 0 | 0 | 0 |
| Jalen Thompson | 9/6 | 1 | 0 | 0 | 0 | 0 |
| Mack Wilson Sr. | 8/3 | 1 | 1 | 1 | 0 | 0 |
| Budda Baker | 7/4 | 0 | 0 | 0 | 0 | 0 |
| Sean Murphy-Bunting | 7/3 | 0 | 0 | 0 | 0 | 0 |
| Owen Pappoe | 5/4 | 0 | 0 | 0 | 0 | 0 |
| Dante Stills | 5/2 | 1 | 1 | 1 | 0 | 0 |
| Dennis Gardeck | 4/2 | 1 | 0 | 0 | 1 | 1 |
| Zaven Collins | 4/3 | 1 | 0 | 0 | 0 | 0 |
| Khyiris Tonga | 4/1 | 0 | 0 | 0 | 0 | 0 |
| Garrett Williams | 3/3 | 0 | 0 | 0 | 0 | 0 |
| Bilal Nichols | 3/2 | 1 | 0 | 0 | 0 | 0 |
| Team Total | 87/43 | 6 | 2 | 2 | 1 | 1 |
Gardeck’s interception at the Detroit 43 gave Arizona prime field position. They drove to the 24 but turned the ball over on downs when Murray was stopped short on 4th-and-1. Baker briefly left the game but returned.
Special Teams Breakdown
| Team | Player | Category | Performance |
|---|---|---|---|
| DET | Jack Fox | Punting | 5 punts, 247 yards (49.4 avg), 68-yard long, 4 inside 20 |
| ARI | Blake Gillikin | Punting | 5 punts, 260 yards (52.0 avg), 63-yard long, 1 inside 20 |
| DET | Kalif Raymond | Returns | 4 punt returns, 40 yards (10.0 avg) |
| DET | Jake Bates | Kicking | 0/0 FG, 2/3 XP |
| ARI | Matt Prater | Kicking | 2/2 FG (42, 45 yards), 1/1 XP |
Fox consistently pinned Arizona deep. His four punts inside the 20 forced the Cardinals to drive long fields. Neither team attempted a kickoff return, with all five kickoffs resulting in touchbacks.
Key Statistical Comparisons
| Category | Detroit | Arizona |
|---|---|---|
| Total Yards | 373 | 277 |
| Rushing Yards | 187 | 77 |
| Passing Yards | 186 | 200 |
| First Downs | 23 | 17 |
| Third Downs | 6/12 (50%) | 1/9 (11.1%) |
| Fourth Downs | 0/1 | 0/2 |
| Red Zone | 2/2 (100%) | 1/1 (100%) |
| Time of Possession | 36:49 | 23:11 |
| Total Plays | 68 | 53 |
| Penalties | 9-79 | 4-30 |
| Turnovers | 1 | 1 |
Arizona’s 11.1% third-down conversion rate killed drives before they could develop. Their lone conversion came on a 3-yard pass to Wilson on 3rd-and-2 in the first quarter.
Drive Chart: How Detroit Controlled the Game
Detroit’s most impressive drive came in the second quarter: 13 plays, 75 yards, 7:41 off the clock. The drive included three third-down conversions and ended with St. Brown’s 5-yard touchdown catch.
Their final drive proved equally important. Taking over with 3:48 remaining, the Lions converted a crucial 3rd-and-12 when Goff found St. Brown for 18 yards. They then ran three kneel-downs to end the game.
Arizona’s longest drive covered 67 yards over nine plays in the fourth quarter, resulting in Prater’s 45-yard field goal. They never possessed the ball for longer than 5:08 on any single drive.
Turning Points
Second Quarter Hook-and-Ladder (0:36): Down 13-7, Arizona had just been stopped by the two-minute warning, nullifying what would have been a pick-six. Detroit capitalized immediately with the trick play touchdown.
Third Quarter End Zone Interception: Trailing 20-10, Arizona drove to the Detroit 20. Murray’s pass intended for Harrison Jr. was picked off by Joseph, ending their best scoring chance of the half.
Fourth Down Stop: After Gardeck’s interception, Arizona reached the Detroit 24. On 4th-and-1, Davis and the defensive line stopped Murray inches short.
Officials and Game Information
Referee Crew: Kent Payne (referee), Bruce Stritesky, Greg Yette, Bradley Rogers, Anthony Jeffries, Daniel Gallagher, Joe Blubaugh
The game started at 4:25 PM ET (1:25 AM UK time on September 23, 2024). Weather conditions were controlled inside State Farm Stadium’s retractable roof venue.
Season Context
This victory moved Detroit to 2-1, bouncing back from their season-opening loss. The Lions have now scored 20+ points in back-to-back games. Check their previous game against Minnesota for comparison.
Arizona fell to 1-2, with both losses coming at home. Their rushing attack has been a consistent problem, as seen in their recent loss to Green Bay.
According to NFL.com’s official box score, Detroit’s 187 rushing yards marked their highest total of the young season. Pro Football Focus graded Goff’s performance as one of the week’s best quarterback showings.
Detroit’s ability to control the line of scrimmage on both sides of the ball proved decisive. The Lions ran 15 more plays than Arizona, converted third downs at a 39% higher rate, and dominated time of possession by nearly 14 minutes. These Detroit Lions vs Arizona Cardinals match player stats reflect a complete team victory built on offensive balance and defensive opportunism.