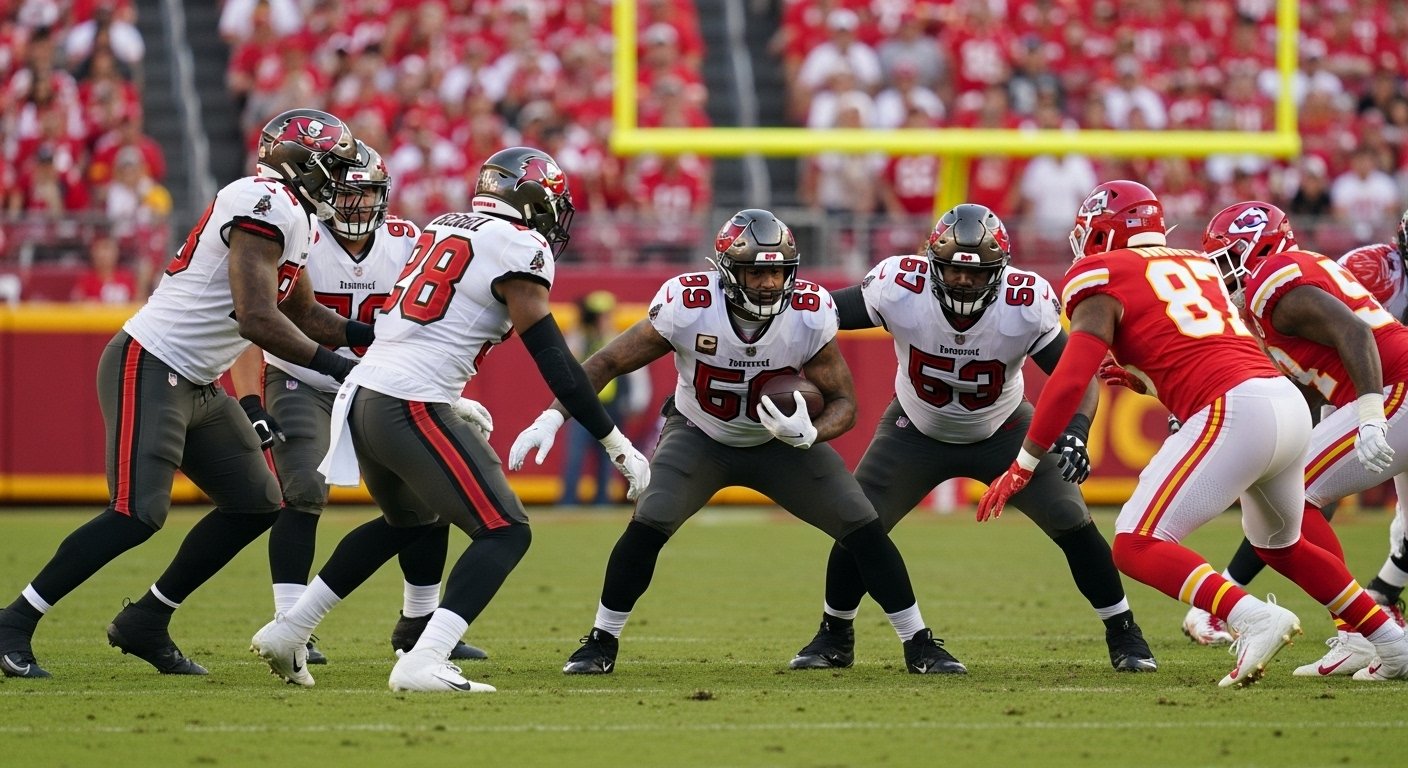
Tampa Bay Buccaneers vs Kansas City Chiefs Match Player Stats (Nov 4, 2024)
The Tampa Bay Buccaneers vs Kansas City Chiefs match player stats from their Week 9 Monday Night Football clash reveal how Patrick Mahomes and company extended their perfect season with a 30-24 overtime victory. The Chiefs improved to 8-0 and stretched their winning streak to 14 games dating back to last season, while Tampa Bay fell to 4-5 after their fourth loss in five games.
Rain-soaked conditions at GEHA Field at Arrowhead Stadium on November 4, 2024, set the stage for a classic AFC-NFC showdown that needed an extra period to decide. Kansas City’s dominance in time of possession (40:42 to 25:10) and third-down conversions (66.7%) ultimately wore down a Tampa Bay defense that started hot but faded when it mattered most.
Table of Contents
Game Flow and Scoring Breakdown
The Chiefs struck first with Harrison Butker’s 40-yard field goal at the 2:16 mark of the opening quarter. Tampa Bay answered in the second when Kansas City native Rachaad White punched in a 7-yard touchdown run, nearly launching the ball into the stands in celebration of his homecoming score.
According to CBS Sports’ detailed box score, the teams traded scores throughout, with four lead changes keeping the 73,574 fans on edge:
| Quarter | Time | Team | Scoring Play | Score |
|---|---|---|---|---|
| 1 | 2:16 | KC | Harrison Butker 40-yard FG | 0-3 |
| 2 | 10:23 | TB | Rachaad White 7-yard rush | 7-3 |
| 2 | 4:05 | KC | DeAndre Hopkins 1-yard pass from Mahomes | 7-10 |
| 3 | 11:36 | TB | Cade Otton 11-yard pass from Mayfield | 14-10 |
| 3 | 5:50 | TB | Chase McLaughlin 47-yard FG | 17-10 |
| 4 | 14:14 | KC | Samaje Perine 7-yard pass from Mahomes | 17-17 |
| 4 | 4:17 | KC | DeAndre Hopkins 5-yard pass from Mahomes | 17-24 |
| 4 | 0:27 | TB | Ryan Miller 1-yard pass from Mayfield | 24-24 |
| OT | 4:08 | KC | Kareem Hunt 2-yard rush | 24-30 |
The Buccaneers seized momentum after halftime when Bucky Irving’s 46-yard kickoff return set up Cade Otton’s 11-yard touchdown catch. Chase McLaughlin’s 47-yard field goal extended Tampa Bay’s lead to 17-10, their largest advantage of the night.
Quarterback Duel: Mahomes vs Mayfield Statistical Comparison
Patrick Mahomes delivered another signature performance in primetime, completing 34 of 44 passes for 291 yards and three touchdowns. His counterpart Baker Mayfield, playing without top receivers Mike Evans and Chris Godwin, kept pace with 23 completions on 31 attempts for 200 yards and two scores.
| Statistic | Patrick Mahomes (KC) | Baker Mayfield (TB) |
|---|---|---|
| Completions/Attempts | 34/44 | 23/31 |
| Passing Yards | 291 | 200 |
| Touchdowns | 3 | 2 |
| Interceptions | 0 | 0 |
| Passer Rating | ||
| Sacks Taken | 4 for 31 yards | 2 for 11 yards |
| PFF Grade | 84.9 | 71.9 |
Mayfield’s 71.9 Pro Football Focus grade actually led Tampa Bay’s offense on the night. Working with a depleted receiving corps, he engineered the game-tying drive with 2:17 remaining, finding Sterling Shepard and Trey Palmer for key completions before hitting Ryan Miller for the equalizing touchdown.
Mahomes tweaked his ankle while delivering a touchdown pass to Samaje Perine in the fourth quarter but never left the game. His perfect 5-for-5 passing in overtime sealed Tampa Bay’s fate after the Chiefs won the coin toss.
Third Down Excellence Decides the Game
Kansas City’s 12-for-18 performance on third down compared to Tampa Bay’s 5-for-11 showing proved decisive. According to ESPN’s game analysis, Mahomes went 11-for-13 for 126 yards on third downs with a +8.3% Completion Percentage Over Expected.
Even more remarkable: all three of Mahomes’ touchdown passes came on third down. The Chiefs converted third downs of 8, 5, and 1 yards for scores, showcasing their red zone efficiency and situational football mastery.
Key Offensive Performers
Kansas City Chiefs Weapons
| Player | Position | Key Stats | Impact |
|---|---|---|---|
|
27
Kareem Hunt
|
RB | 27 carries, 106 yards, 1 TD | Game-winning 2-yard TD run in OT |
|
87
Travis Kelce
|
TE | 14 receptions, 100 yards, 1 fumble lost | Career-high catches despite crucial fumble |
|
8
DeAndre Hopkins
|
WR | 8 catches, 86 yards, 2 TDs | 1-yard and 5-yard TD catches on third down |
|
34
Samaje Perine
|
RB | 7-yard TD reception | Tied game at 17-17 in Q4 |
Hunt’s workload (27 carries) exemplified Kansas City’s commitment to controlling the clock and wearing down Tampa Bay’s defense. His 3.9 yards per carry average won’t jump off the stat sheet, but his grinding style proved effective in overtime.
Hopkins, acquired from Tennessee just two weeks prior, announced his arrival with authority. His eight catches doubled his production from his Chiefs debut, and both touchdowns came in crucial third-down situations.
Tampa Bay’s Supporting Cast Steps Up
| Player | Position | Key Stats | Impact |
|---|---|---|---|
|
88
Cade Otton
|
TE | 8 catches, 77 yards, 1 TD | 11-yard TD catch in Q3 |
|
1
Rachaad White
|
RB | 11 carries, 45 yards, 1 TD | Kansas City native’s emotional homecoming score |
|
25
Bucky Irving
|
RB | 9 carries, 35 yards, 46-yard KO return | Set up go-ahead TD in Q3 |
|
18
Ryan Miller
|
WR | 1 catch, 1 yard, 1 TD | Game-tying TD with 0:27 left |
|
10
Sterling Shepard
|
WR | Multiple catches on final drive | Key target in clutch moments |
Without their star receivers, Tampa Bay leaned heavily on tight end Cade Otton, who led the team with eight receptions. His rapport with Mayfield kept drives alive throughout the night.
Defensive Performances and Pass Rush Breakdown
Tampa Bay’s interior defensive line dominated early, with Vita Vea and rookie Calijah Kancey combining for four sacks of Mahomes. The pressure was most effective in the first three quarters before fatigue became a factor.
| Defensive Player | Team | Tackles | Sacks | Key Play |
|---|---|---|---|---|
| Antoine Winfield Jr. | TB | 12 (5 solo) | 0 | Team-high tackles |
| Vita Vea | TB | 10 (7 solo) | 2.0 | Career-high tackles, 3 QB hits |
| Calijah Kancey | TB | 2 (2 solo) | 2.0 | First multi-sack game, 3 QB hits |
| Tykee Smith | TB | 9 (8 solo) | 0 | Forced fumble on Travis Kelce |
| Chris Jones | KC | N/A | 0 | 89.1 PFF grade (game-high), 2 QB pressures |
| George Karlaftis | KC | 4 (3 solo) | 1.0 | 1 TFL, key pressure late |
The telling stat: after sacking Mahomes on the opening drive of the third quarter, Tampa Bay’s pass rush failed to bring him down again. The Chiefs’ offensive line, anchored by center Creed Humphrey and left tackle Donovan Smith, adjusted their protection schemes and gave Mahomes the time he needed in the game’s crucial moments.
Chris Jones earned the game’s highest Pro Football Focus grade (89.1) despite recording zero sacks, illustrating how interior pressure doesn’t always show up in traditional statistics. His consistent push collapsed the pocket and forced Mayfield into quicker decisions.
Complete Team Statistics Comparison
The full statistical breakdown reveals how Kansas City’s methodical approach overcame Tampa Bay’s big-play potential:
| Category | Tampa Bay | Kansas City |
|---|---|---|
| Total Yards | 284 | 384 |
| Total Plays | 52 | 83 |
| Yards Per Play | 5.5 | 4.6 |
| First Downs | 17 | 28 |
| Passing Yards | 189 | 260 |
| Rushing Yards | 95 | 124 |
| 3rd Down Efficiency | 5-11 (45.5%) | 12-18 (66.7%) |
| 4th Down Efficiency | 0-0 | 1-1 (100%) |
| Red Zone TDs | 3-3 (100%) | 4-4 (100%) |
| Turnovers | 0 | 1 |
| Penalties | 6-50 | 3-30 |
| Time of Possession | 25:10 | 40:42 |
Tampa Bay actually averaged more yards per play (5.5 to 4.6), but Kansas City’s ability to sustain drives through third-down conversions and run 31 more offensive plays proved more valuable than explosive gains.
Ground Game Analysis
The rushing attack became increasingly important as rain intensified during the fourth quarter:
Kansas City Chiefs Rushing:
- Kareem Hunt: 27 carries, 106 yards (3.9 avg), 1 TD
- Patrick Mahomes: 2 scrambles for 4 yards (including ankle tweak)
- Team Total: 124 yards on 31 attempts
Tampa Bay Buccaneers Rushing:
- Rachaad White: 11 carries, 45 yards, 1 TD
- Bucky Irving: 9 carries, 35 yards
- Baker Mayfield: 3 scrambles, 15 yards
- Team Total: 95 yards on 24 attempts
Kansas City’s 31 rushing attempts compared to Tampa Bay’s 24 reflects their ball-control philosophy and success on early downs that set up manageable third-down situations.
Special Teams Impact
Special teams provided crucial momentum swings in a game decided by six points:
| Special Teams | Tampa Bay | Kansas City |
|---|---|---|
| Field Goals | Chase McLaughlin 1/1 (47 yards) | Harrison Butker 1/1 (40 yards) |
| Extra Points | McLaughlin 3/3 | Butker 3/3 |
| Punting | Tristan Gill: 5 punts, 43.2 avg, 2 inside 20 | Matt Araiza: 4 punts, 42.8 avg, 1 inside 20 |
| Kickoff Returns | Bucky Irving: 1 for 46 yards | None |
| Punt Returns | Trey Palmer: 2 for 18 yards (9.0 avg) | Mecole Hardman: 1 for 30 yards |
Bucky Irving’s 46-yard return to open the second half directly led to Tampa Bay taking a 14-10 lead. Both kickers remained perfect in challenging conditions, with McLaughlin drilling a 47-yarder to extend Tampa Bay’s lead to 17-10 in the third quarter.
The Hopkins Factor and Advanced Metrics
DeAndre Hopkins’ immediate impact in his second game as a Chief cannot be overstated. According to Pro Football Reference box score, Hopkins posted a +8.6 EPA (Expected Points Added) on in-breaking routes, his highest mark since Week 14 of 2020.
His most spectacular play came on a 35-yard reception in triple coverage that had just a 12.3% completion probability. As NFL.com noted, it was Mahomes’ most improbable completion since 2018. The catch set up Hopkins’ first touchdown as a Chief, which he celebrated with a “Remember the Titans” dance.
Pro Football Focus grades for the game’s top performers:
- Chris Jones: 89.1
- Patrick Mahomes: 84.9
- DeAndre Hopkins: 82.6
Tampa Bay’s offensive line struggled in pass protection, with left guard Ben Bredeson (39.1 PFF grade) and right guard Cody Mauch (51.7) particularly exposed by Kansas City’s interior rush.
Todd Bowles’ Critical Decision
The game’s pivotal moment came with 27 seconds remaining in regulation. After Ryan Miller’s touchdown made it 24-23, Bowles elected to kick the extra point rather than attempt a two-point conversion for the win. His postgame explanation: “Very minor thought. We wanted to get it to overtime with the wet conditions on the field.”
Analytics models showed the decision as essentially a coin flip probability-wise, but context matters. Tampa Bay’s defense had been on the field for over 40 minutes and hadn’t sacked Mahomes since the third quarter. Giving Kansas City the ball first in overtime with those circumstances proved fatal.
Andy Reid’s reaction? “No, but I’m glad he didn’t [go for two].”
Overtime Execution
Kansas City won the coin toss and never gave the ball back. Mahomes completed all five pass attempts for 52 yards on a 10-play, 70-yard drive that consumed 5:52. The march included conversions on second-and-5 and second-and-8 before Hunt’s 2-yard plunge ended Tampa Bay’s upset bid.
Mayfield never touched the ball in overtime, a cruel ending after his heroic fourth-quarter drive. The Buccaneers became the latest victim of the NFL’s overtime rules that don’t guarantee both teams a possession.
Statistical Context and Team Trends
For additional context on these teams’ recent performances, check out analysis of the Kansas City Chiefs vs Atlanta Falcons match player stats and Tampa Bay Buccaneers vs Dallas Cowboys match player stats.
The Chiefs have now won 14 straight games dating to last season, becoming the sixth Super Bowl champion to start 8-0 the following year. Their formula remains consistent: control time of possession, dominate third downs, and trust Mahomes in crucial moments.
Tampa Bay’s loss dropped them to 4-5 and two games behind Atlanta in the NFC South. Despite the setback, Mayfield’s performance without his top weapons suggests this team could make noise if they get healthy.
Frequently Asked Questions
Q: Who had the best individual performance in the Buccaneers vs Chiefs game?
A: Chris Jones dominated with an 89.1 PFF grade despite zero sacks, consistently disrupting Tampa Bay’s offense. For skill players, Travis Kelce’s career-high 14 receptions and DeAndre Hopkins’ two crucial third-down touchdowns stand out. Mahomes going 11-for-13 on third downs ranks among the best situational performances you’ll see.
Q: How did the Chiefs dominate time of possession so thoroughly?
A: Third-down conversions tell the story. Kansas City’s 66.7% success rate (12-for-18) allowed them to extend drives that Tampa Bay couldn’t. Each conversion added plays, burned clock, and exhausted the Buccaneers’ defense. Combine that with 27 carries for Hunt, and you get a 40:42 to 25:10 time advantage.
Q: What was the most crucial play of the game?
A: Three candidates deserve mention: Hopkins’ 12.3% probability catch that showcased the Mahomes-Hopkins connection, Kelce’s fumble that kept Tampa Bay close, and Bowles’ extra point decision. The coaching choice looms largest since kicking that PAT essentially handed the game to Mahomes in overtime.
Q: How did injuries impact the Buccaneers’ offensive performance?
A: Missing Mike Evans and Chris Godwin forced Mayfield to rely on Cade Otton (8 catches), Sterling Shepard, and practice squad call-up Ryan Miller. That Mayfield posted a 112.3 passer rating and zero turnovers under these circumstances speaks to his toughness and the offensive coaching staff’s adaptability.
Q: What made DeAndre Hopkins so effective in this game?
A: Route precision and chemistry with Mahomes. Hopkins destroyed Tampa Bay on in-breaking routes, generating +8.6 EPA on these patterns. It was his best performance since 2020. Both touchdowns came on these routes where he found soft spots in zone coverage. The Bucs never adjusted their coverage to account for it.
Q: How did the overtime play out exactly?
A: Clinical execution by Kansas City. After winning the toss, Mahomes went 5-for-5 for 52 yards. The 10-play, 70-yard drive took 5:52 and included first-down conversions to Hunt (11 yards), Kelce (7 and 15 yards), and Hopkins (15 yards). Hunt’s 2-yard touchdown run came on third-and-1, ending the game without Tampa Bay’s offense taking the field.
The Tampa Bay Buccaneers vs Kansas City Chiefs match player stats illustrate why the Chiefs remain the NFL’s gold standard. Their ability to win through sustained drives and third-down excellence, rather than relying solely on explosive plays, makes them nearly impossible to beat when games matter most.