
New England Patriots vs Miami Dolphins Match Player Stats (Nov 24, 2024)
The Week 12 matchup between New England and Miami ended with the Dolphins winning 34-15 at Hard Rock Stadium on November 24, 2024. These complete player statistics and team performances from the game show how Miami improved to 5-6 while New England dropped to 3-9. For the Patriots, this loss guaranteed their third consecutive losing season, something that hadn’t happened since 1991-93.
Table of Contents
Game Overview and Key Metrics
The 65,479 fans who packed Hard Rock Stadium witnessed Miami control every phase. The Dolphins outgained New England 373-268 in total yards, dominated time of possession 32:04 to 27:56, and forced two critical turnovers while committing just one.
Team Performance Summary
| Category | New England Patriots | Miami Dolphins |
|---|---|---|
| Total Yards | 268 | 373 |
| Passing Yards | 182 | 308 |
| Rushing Yards | 86 | 65 |
| First Downs | 14 | 23 |
| Third Down Efficiency | 3/14 (21.4%) | 4/12 (33.3%) |
| Penalties | 10 for 75 yards | 3 for 17 yards |
| Turnovers | 2 | 1 |
New England’s 10 penalties killed multiple drives, including four false starts from left tackle Vederian Lowe alone. The discipline gap proved decisive.
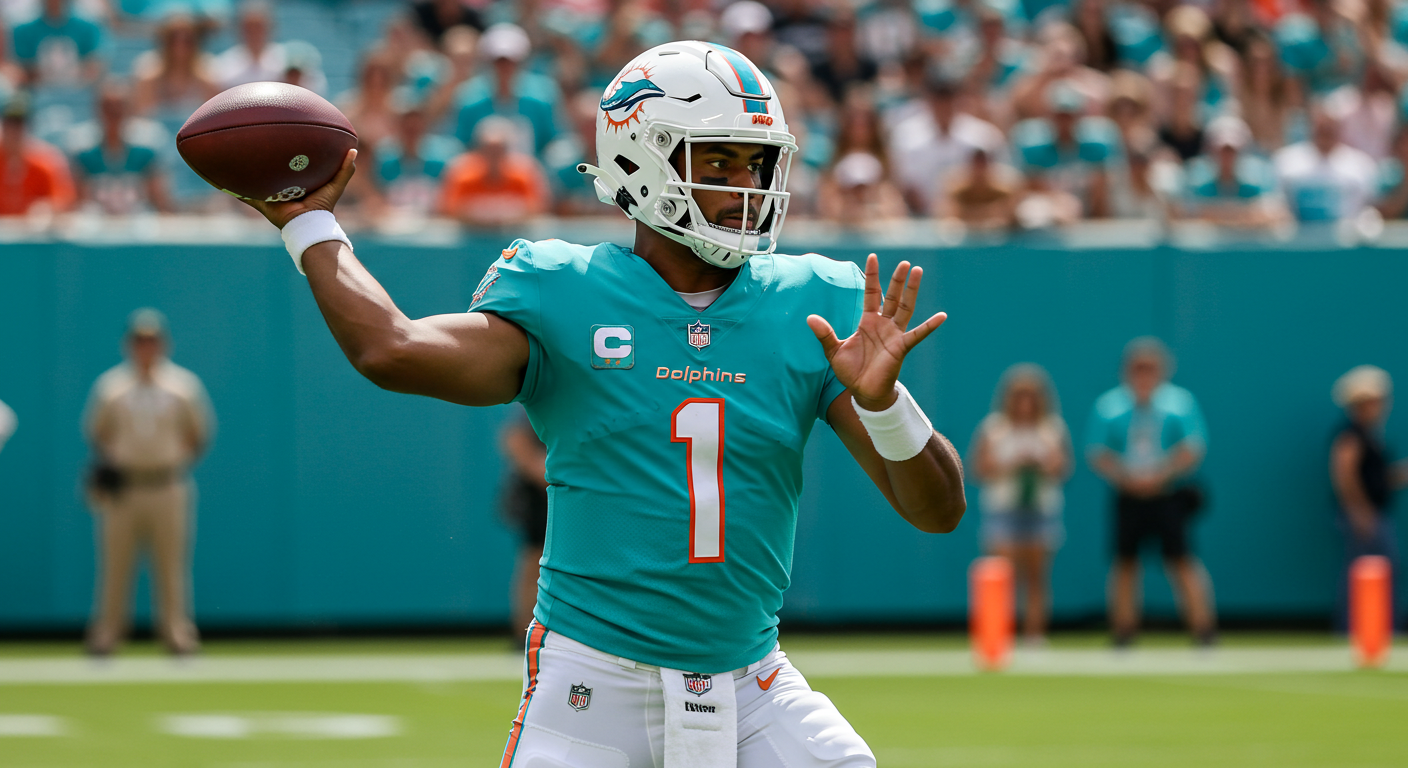
Quarterback Comparison: Experience vs Youth
Tua Tagovailoa now owns a perfect 7-0 career record against New England. His performance on Sunday reinforced why Bill Belichick’s old defensive schemes no longer work against him.
Quarterback Statistical Breakdown
| Stat Category | Tua Tagovailoa (MIA) | Drake Maye (NE) |
|---|---|---|
| Completions/Attempts | 29/40 | 22/37 |
| Passing Yards | 317 | 222 |
| Touchdowns | 4 | 1 |
| Interceptions | 0 | 1 |
| Completion % | 72.5% | 59.5% |
| Passer Rating | 128.9 | 74.4 |
| Average Time to Throw | 2.34 seconds | 2.82 seconds |
| Sacks Taken | 2 for 9 yards | 4 for 39 yards |
Miami’s offensive strategy centered on pre-snap motion, using it on 93.7% of plays, their highest rate all season. Tagovailoa completed 27 of 37 attempts when employing motion, throwing all four touchdowns on these plays. His 2.34-second release time ranks as his third-fastest this season, neutralizing New England’s pass rush.
Drake Maye faced constant pressure, particularly against the blitz. On 15 dropbacks versus extra rushers, he managed just 6 completions on 12 attempts for 31 yards, took two sacks, and threw an interception. His PFF grade plummeted from 72.1 without blitz pressure to 40.8 when Miami sent extra defenders.
Ground Game Statistics
Neither team established consistent rushing success, though individual performances varied significantly.
Rushing Performance Analysis
| Player | Team | Carries | Yards | Average | Long | TDs |
|---|---|---|---|---|---|---|
| De’Von Achane | MIA | 10 | 32 | 3.2 | 9 | 0 |
| Antonio Gibson | NE | 6 | 31 | 5.2 | 14 | 0 |
| Jaylen Wright | MIA | 7 | 28 | 4.0 | 12 | 0 |
| Drake Maye | NE | 5 | 26 | 5.2 | 9 | 0 |
| JaMycal Hasty | NE | 1 | 15 | 15.0 | 15 | 0 |
| Rhamondre Stevenson | NE | 8 | 13 | 1.6 | 9 | 0 |
Rhamondre Stevenson’s struggles continued with just 1.6 yards per carry on eight attempts. His inability to generate positive yardage reflects New England’s broader offensive line failures. De’Von Achane’s modest rushing totals didn’t matter since he scored twice through the air instead.
Pass Catching Production
Related coverage: Buffalo Bills vs Miami Dolphins match player stats shows similar offensive patterns for the Dolphins.
Receiving Statistics Breakdown
| Player | Team | Receptions | Yards | Average | TDs | Targets |
|---|---|---|---|---|---|---|
| Jaylen Waddle | MIA | 8 | 144 | 18.0 | 1 | 9 |
| Jonnu Smith | MIA | 9 | 87 | 9.7 | 1 | 11 |
| DeMario Douglas | NE | 5 | 62 | 12.4 | 0 | 7 |
| Austin Hooper | NE | 4 | 59 | 14.8 | 1 | 4 |
| Tyreek Hill | MIA | 5 | 48 | 9.6 | 0 | 6 |
| Hunter Henry | NE | 5 | 44 | 8.8 | 0 | 8 |
| Kendrick Bourne | NE | 3 | 30 | 10.0 | 0 | 5 |
| De’Von Achane | MIA | 3 | 24 | 8.0 | 2 | 4 |
Jaylen Waddle posted a season-high 144 receiving yards, with six catches gaining 15+ yards. His emergence allowed Miami to attack vertically despite Christian Gonzalez’s excellent coverage on Tyreek Hill. Jonnu Smith tormented his former team with 9 catches on 11 targets, exploiting mismatches against New England’s safeties.
Defensive Statistical Leaders
Individual defensive performances varied wildly, with some players excelling while others struggled mightily.
| Player | Pos | Total | Solo | Sacks | TFL | PBU | QB Press |
|---|---|---|---|---|---|---|---|
| Jordyn Brooks | LB | 9 | 7 | 0 | 1 | 0 | 2 |
| Jordan Poyer | S | 7 | 7 | 0 | 0 | 1 | 0 |
| Jevon Holland | S | 6 | 5 | 0 | 1 | 0 | 1 |
| Chop Robinson | EDGE | 4 | 2 | 1.5 | 1 | 2 | 10 |
| Zach Sieler | DT | 4 | 3 | 1 | 2 | 0 | 3 |
| Jalen Ramsey | CB | 4 | 3 | 1 | 1 | 1 | 2 |
| Player | Pos | Total | Solo | Sacks | TFL | PBU |
|---|---|---|---|---|---|---|
| Marcus Jones | CB | 8 | 8 | 0 | 0 | 3 |
| Jahlani Tavai | LB | 8 | 3 | 0 | 1 | 1 |
| Jonathan Jones | CB | 6 | 4 | 0 | 0 | 0 |
| Kyle Dugger | S | 6 | 4 | 0 | 1 | 1 |
| Anfernee Jennings | LB | 6 | 3 | 0 | 0 | 0 |
| Christian Gonzalez | CB | 3 | 2 | 0 | 0 | 1 |
Chop Robinson’s 10 quarterback pressures (per PFF analysis) announced his arrival as a legitimate pass-rushing threat. He consistently beat right tackle Demontrey Jacobs, who allowed nine of those pressures. Christian Gonzalez limited Tyreek Hill to one catch for 10 yards when in coverage, showcasing elite cornerback play despite the team’s overall struggles.
Scoring Progression: Quarter-by-Quarter Breakdown
First Quarter (0-0): Joey Slye missed a 45-yard field goal after New England drove 80 yards on 12 plays. Three accepted penalties stalled the drive, foreshadowing the discipline issues ahead.
Second Quarter (Miami 24-0):
- 14:10 – Jonnu Smith 7-yard TD reception (8 plays, 65 yards, 3:57)
- 7:50 – De’Von Achane 9-yard TD reception (9 plays, 66 yards, 4:47)
- 1:50 – De’Von Achane 11-yard TD reception (10 plays, 80 yards, 4:13)
- 0:02 – Jason Sanders 21-yard field goal (7 plays, 56 yards, 1:26)
Miami outgained New England 281-85 in first-half total yards.
Third Quarter (Miami 31-0):
- 1:37 – Jaylen Waddle 23-yard TD reception
This score came immediately after Zach Sieler strip-sacked Drake Maye, with Jordyn Brooks recovering at the New England 25-yard line.
Fourth Quarter:
- 13:43 – Austin Hooper 38-yard TD reception from Maye (NE)
- 10:10 – Christian Gonzalez 63-yard fumble return TD (NE)
- 3:33 – Jason Sanders 51-yard field goal (MIA)
New England’s 15 fourth-quarter points came against Miami’s prevent defense and included a defensive touchdown.
Critical Turnovers
Turnover Details
| Time | Player | Team | Type | Details | Result |
|---|---|---|---|---|---|
| 2:27 3rd | Drake Maye | NE | Fumble | Strip-sack by Zach Sieler, recovered by Jordyn Brooks at NE 25 | Miami TD |
| 5:19 4th | Drake Maye | NE | INT | Intercepted by Tyrel Dodson at MIA 46 | Miami FG |
| 10:10 4th | Jaylen Wright | MIA | Fumble | Recovered and returned 63 yards for TD by Christian Gonzalez | NE TD |
Special Teams Performance
See more AFC East special teams comparisons in New York Jets vs Miami Dolphins player stats.
Kicking and Punting Stats
| Category | New England | Miami |
|---|---|---|
| Field Goals & PATs | ||
| Field Goals | 0/1 (0%) | 2/2 (100%) |
| Extra Points | 1/1 | 4/4 |
| Kicker Points | 1 | 10 |
| Punting | ||
| Total Punts | 5 | 5 |
| Gross Average | 51.8 | 48.0 |
| Net Average | 42.0 | 41.2 |
| Longest Punt | 69 | 53 |
| Inside 20 | 2 | 2 |
| Returns | ||
| Punt Returns | 3 for 38 yards | 2 for 15 yards |
| Punt Return Average | 12.7 | 7.5 |
| Kickoff Returns | 0 | 0 |
Bryce Baringer’s 69-yard punt highlighted New England’s field position struggles. Despite excellent punting, the offense couldn’t capitalize on favorable starting positions.
Offensive Line Analysis
The protection numbers expose New England’s fundamental problem:
Pass Protection Metrics
| Player | Team | Position | PFF Grade | Pressures Allowed | Sacks Allowed | Penalties |
|---|---|---|---|---|---|---|
| Demontrey Jacobs | NE | RT | 22.6 | 9 | 2 | 2 |
| Vederian Lowe | NE | LT | 51.7 | 4 | 1 | 4 |
| Jacobs’ 17.9 pass-blocking grade was among the worst single-game performances by any tackle this season | ||||||
| Miami O-Line Total | Unit | 7 | 0 | 0 | ||
| New England O-Line Total | Unit | 22 | 4 | 7 | ||
Jacobs’ 17.9 pass-blocking grade ranks among the worst single-game performances by any tackle this season. Miami’s offensive line, by contrast, kept Tagovailoa clean throughout, allowing him to operate the quick-passing game effectively.
Red Zone and Third Down Efficiency
Situational Football Stats
| Category | New England | Miami |
|---|---|---|
| Time of Possession | 27:56 | 32:04 |
| Third Down Conversions | 3/14 (21.4%) | 4/12 (33.3%) |
| Fourth Down Conversions | 1/3 (33.3%) | 0/0 |
| Red Zone Attempts | 0 | 4 |
| Red Zone TDs | 0 | 3/4 (75%) |
| Total Turnovers | 2 | 1 |
| Penalties | 10 for 75 yards | 3 for 17 yards |
New England failed to reach the red zone even once, a damning indictment of their offensive dysfunction.
Individual Player Grades (via Pro Football Focus)
Top Performers
- Austin Hooper (NE): 79.1 overall grade
- Christian Elliss (NE): 78.4 overall grade
- Chop Robinson (MIA): 70.0 overall grade
- Christian Gonzalez (NE): 70.1 overall grade
Lowest Grades
- Demontrey Jacobs (NE): 22.6 overall (17.9 pass-blocking)
- Kyle Dugger (NE): 33.4 overall (allowed 6 completions for 74 yards, 2 TDs)
- Vederian Lowe (NE): 51.7 overall
Game Officials
Referee Derick Bowers led the officiating crew including Greg Meyer, Tab Slaughter, Dale Shaw, John Jenkins, Alan Eck, and Derek Anderson. The penalty disparity (10-75 vs 3-17) reflected genuine discipline problems rather than biased officiating.
Historical Perspective
According to Miami Dolphins official website, Tagovailoa’s 7-0 record against New England ranks among the best starts by any quarterback versus a single opponent in the Super Bowl era. His mastery of the Patriots defense continues a trend that began in his rookie season.
Pro Football Focus analysis highlighted Miami’s schematic advantages, particularly their use of pre-snap motion to create favorable matchups. The 93.7% motion rate effectively diagnosed New England’s coverage and created the space Tagovailoa needed to dissect the defense.
Context and Implications
This result dropped New England to 3-9, their worst 12-game start since 1992. The offensive line’s collapse, particularly at tackle, represents an organizational failure that goes beyond one game. Drake Maye has now been sacked 38 times in just over six starts, a pace that threatens both his development and health.
Miami improved to 5-6, keeping their playoff hopes alive despite a difficult start to the season. The offensive explosion against a division rival could spark the momentum they need for a late-season push. With Tagovailoa healthy and the passing game clicking, they remain dangerous despite their record.
The contrasting trajectories of these franchises became evident in every statistical category. While Miami executed a modern, motion-heavy offense with precision timing, New England’s outdated approach and personnel deficiencies left them unable to compete. Until the Patriots address their protection issues and modernize their offensive philosophy, games with similar statistical disparities will become increasingly common.
Final Analysis
The complete game statistics from this Week 12 divisional matchup show fundamental roster construction flaws and coaching philosophy differences between these teams. Miami’s comprehensive victory validated their offensive system while exposing New England’s critical weaknesses in pass protection, discipline, and offensive creativity. For Patriots fans hoping for improvement, the path forward requires significant offseason changes, starting with a complete offensive line overhaul. Every statistical category from this game points to the same conclusion: Miami has solved this rivalry while New England must rebuild from the ground up.