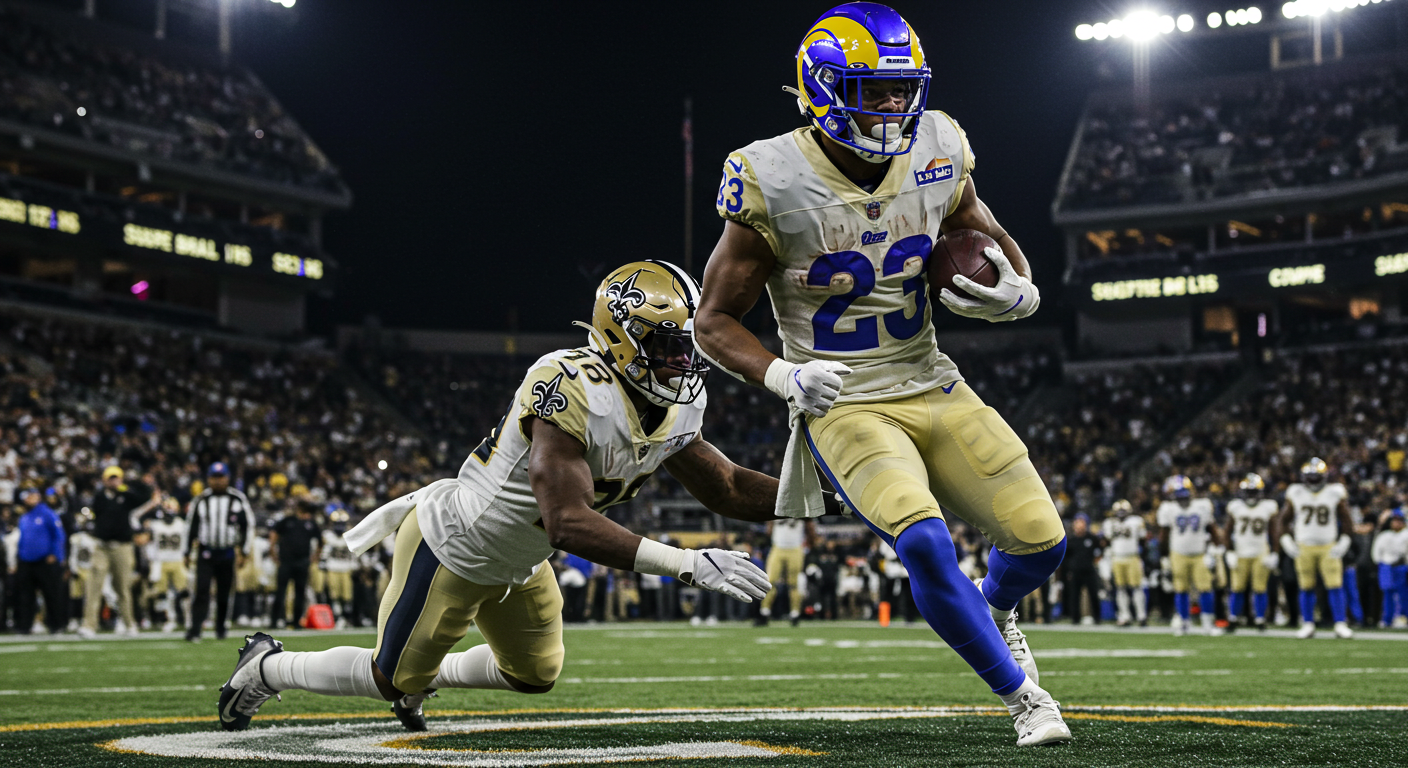
Los Angeles Rams vs New Orleans Saints Match Player Stats (Dec 1, 2024)
December 1, 2024 | Caesars Superdome, New Orleans | Attendance: 70,006
The Los Angeles Rams erased a 6-0 halftime deficit to defeat the New Orleans Saints 21-14 in Week 13, scoring all 21 points after halftime. The victory pushed the Rams to 6-6 while the Saints dropped to 4-8 in interim head coach Darren Rizzi’s first loss since taking over.
Table of Contents
Quick Game Summary
Key Stats at a Glance:
- Halftime Score: Saints 6, Rams 0
- Red Zone: Rams 3/3 TDs, Saints 0/2
- Total Plays: Saints 68, Rams 55
- Efficiency: Rams 5.9 yards/play, Saints 4.8
- Game-Deciding Play: Jared Verse deflection on 4th down at LAR 9
Officials: Rick Patterson, Sarah Thomas, Brad Allen, Chad Hill, Duane Heydt, Walter Flowers, Tyree Walton
Why This Game Mattered
The Rams entered December fighting for a playoff spot at 5-6. The Saints, despite their 4-7 record, had won two straight under Rizzi. This matchup featured two teams heading in opposite directions, with playoff implications for Los Angeles.
Complete Team Statistics Breakdown
Offensive Production Comparison
| Category | LA Rams | NO Saints | Impact |
|---|---|---|---|
| Total Yards | 322 | 327 | Nearly even |
| Passing Yards | 166 | 184 | Saints +18 |
| Rushing Yards | 156 | 143 | Rams +13 |
| Yards per Play | 5.9 | 4.8 | Rams +1.1 |
| Time of Possession | 27:23 | 32:37 | Saints +5:14 |
| Total Plays | 55 | 68 | Saints +13 |
Why Yards Per Play Matters: The Rams’ 5.9 yards per play versus the Saints’ 4.8 demonstrates efficiency. This 1.1-yard difference per snap meant the Rams needed 13 fewer plays to nearly match the Saints’ total yardage.
Scoring Drives and Red Zone Execution
| Team | Trips | TDs | FGs | Success Rate |
|---|---|---|---|---|
| LA RAMS | 3 | 3 | 0 | 100% |
| NO SAINTS | 2 | 0 | 0 | 0% |
The 21-point swing in red zone scoring decided this game. The Rams converted all three opportunities into touchdowns while the Saints failed to score on either attempt – a complete reversal of fortune in the game’s most critical area.
Down-by-Down Efficiency
| Situation | LA Rams | NO Saints |
|---|---|---|
| 3rd Down | 4/9 (44.4%) | 5/15 (33.3%) |
| 4th Down | 1/2 (50%) | 2/3 (66.7%) |
| 1st Downs Earned | 22 | 19 |
| By Pass | 9 | 11 |
| By Rush | 12 | 7 |
| By Penalty | 1 | 1 |
Quarterback Analysis: A Tale of Two Halves
Matthew Stafford – Los Angeles Rams
| Half | Comp/Att | Yards | TD | Sacks | Rating | Context |
|---|---|---|---|---|---|---|
| 1st Half | 3/8 (est.) | 23 | 0 | 0 | 47.9 | Lowest for McVay offense |
| 2nd Half | 11/16 (est.) | 160 | 2 | 2-17 | 137.5 | Elite performance |
| Total | 14/24 | 183 | 2 | 2-17 | 110.2 | 7.6 YPA |
Stafford’s 23 first-half passing yards marked the first time a Sean McVay offense failed to reach 50 yards passing before halftime. His second-half transformation included touchdown passes of 3 yards to Demarcus Robinson and 7 yards to Puka Nacua.
Derek Carr – New Orleans Saints
| Metric | Performance | NFL Average | Analysis |
|---|---|---|---|
| Comp/Att | 24/37 (64.9%) | 64.2% | On par |
| Yards | 184 | — | Volume without explosion |
| Yards/Attempt | 5.0 | 7.2 | Well below average |
| TD/INT | 1/0 | — | Protected ball |
| Rating | 85.9 | 91.0 | Below average |
| QBR | 76.3 | 50.0 | Above average |
Carr’s 5.0 yards per attempt reflects a conservative passing attack. Despite completing nearly 65% of his passes (24 of 37), the Saints’ aerial attack lacked explosiveness, managing just one completion longer than 28 yards.
Running Game Statistics
Impact Runners
Kyren Williams (LAR) – Game’s Offensive Catalyst
- 15 carries, 104 yards (6.9 YPC)
- 1 touchdown (4-yard run for first lead)
- Season-high rushing total
- Longest run: 17 yards
Alvin Kamara (NO) – Volume Without Payoff
- 23 carries, 112 yards (4.9 YPC)
- 0 touchdowns
- 11th career 100-yard game
- Longest run: 13 yards
- 4 receptions, 7 yards
Complete Rushing Breakdown
LA Rams Rushing
| Player | Carries | Yards | Avg | TD |
|---|---|---|---|---|
| Kyren Williams | 15 | 104 | 6.9 | 1 |
| Blake Corum | 8 | 42 | 5.3 | 0 |
| Puka Nacua | 1 | 7 | 7.0 | 0 |
| Matthew Stafford | 4 | 3 | 0.8 | 0 |
| Total | 29 | 156 | 5.4 | 1 |
Saints Rushing
| Player | Carries | Yards | Avg | TD |
|---|---|---|---|---|
| Alvin Kamara | 23 | 112 | 4.9 | 0 |
| Derek Carr | 2 | 12 | 6.0 | 0 |
| Taysom Hill | 5 | 10 | 2.0 | 0 |
| Kevin Austin Jr. | 1 | 9 | 9.0 | 0 |
| Total | 31 | 143 | 4.6 | 0 |
Receiving Production
Rams Passing Distribution (14 completions on 23 targets)
| Receiver | Rec | Yards | TD | Targets | Catch % | Key Play |
|---|---|---|---|---|---|---|
| Puka Nacua | 5 | 56 | 1 | 8 | 62.5% | 7-yd game-winning TD |
| Demarcus Robinson | 2 | 49 | 1 | 3 | 66.7% | 46-yd catch, 3-yd TD |
| Tutu Atwell | 2 | 39 | 0 | 2 | 100% | 20-yd reception |
| Cooper Kupp | 3 | 17 | 0 | 6 | 50.0% | Limited impact |
| Others | 2 | 22 | 0 | 4 | 50.0% | — |
Saints Passing Distribution (24 completions on 34 targets)
| Receiver | Rec | Yards | TD | Targets | Role |
|---|---|---|---|---|---|
| Taysom Hill | 5 | 37 | 0 | 7 | Lost to injury |
| M. Valdes-Scantling | 2 | 36 | 1 | 3 | Only TD |
| Juwan Johnson | 5 | 36 | 0 | 7 | TE production |
| Kevin Austin Jr. | 3 | 31 | 0 | 3 | Deep threat |
| 5 Other Players | 9 | 44 | 0 | 14 | Committee approach |
Defensive Performance Metrics
Tackles and Impact Plays
LA Rams Defense – Bend Don’t Break
- Total Tackles: 69 (40 solo)
- Sacks: 0
- QB Hits: 3
- Pass Breakups: 6
- Forced Turnovers: 0
Top Performers:
- LB Christian Rozeboom: 12 tackles (7 solo), 1 TFL
- LB Omar Speights: 10 tackles, 1 pass breakup
- S Quentin Lake: 9 tackles (6 solo)
- EDGE Jared Verse: 5 tackles, 3 QB hits, game-sealing deflection
NO Saints Defense – Strong Start, Late Collapse
- Total Tackles: 49 (38 solo)
- Sacks: 2
- QB Hits: 6
- Pass Breakups: 1
- Forced Turnovers: 0
Top Performers:
- S Ugo Amadi: 9 tackles (8 solo)
- LB Pete Werner: 8 tackles (7 solo)
- DT Nathan Shepherd: 1 sack
- DT Bryan Bresee: 1 sack
Special Teams Impact
Field Goal Performance
Blake Grupe (NO) – Mixed Results
- 1st Quarter: 54-yard FG good (7:31)
- 2nd Quarter: 54-yard FG good (14:55)
- 2nd Quarter: 36-yard FG missed after 14-play drive
- Final: 2/3 (66.7%), 6 points
Joshua Karty (LAR) – Perfect on PATs
- 3/3 extra points
- No field goal attempts
Field Position Battle
| Category | Player/Team | Attempts | Yards | Average |
|---|---|---|---|---|
| Punting | Ethan Evans (LAR) | 3 | 116 | 38.7 |
| Punting | Matthew Hayball (NO) | 3 | 128 | 42.7 |
| Kickoff Returns | Jordan Whittington (LAR) | 3 | 100 | 33.3 |
Whittington’s 43-yard kickoff return provided crucial field position for the Rams’ second-half surge.
Game-Changing Moments
6:00 2nd Quarter: Saints’ 14-play drive reaches Rams’ red zone. Penalties push them back. Grupe misses 36-yard field goal. Score remains 6-0.
3rd Quarter: Kyren Williams caps Rams drive with 4-yard TD run. First lead at 7-6.
4th Quarter: Stafford hits Robinson for 3-yard TD (14-6). Later finds Nacua for 7-yard score (21-6).
Final Drive: Saints reach Rams’ 9-yard line. On 4th-and-3, Jared Verse deflects Carr’s pass. Game over.
Injury Report Impact
Three Saints injuries significantly affected the outcome:
- Taysom Hill (knee) – Removed their Swiss Army knife offensive weapon
- Nick Saldiveri (knee) – Further weakened offensive line missing Erik McCoy
- Tyrann Mathieu (shoulder) – Lost veteran defensive leadership
These injuries coincided with the Saints’ second-half offensive struggles and defensive breakdowns.
Statistical Context
The Rams’ offensive efficiency aligns with their recent performances. For comparison, see their dominant showing against Seattle where similar second-half adjustments proved decisive.
The Saints’ red zone failures continue a troubling pattern evident in their struggle against Green Bay earlier this season.
Final Analysis: How Efficiency Beat Volume
This game exemplified how efficiency trumps volume in the NFL. Despite running 13 fewer plays and controlling the ball for five fewer minutes, the Rams maximized their opportunities. Their perfect red zone execution (3 touchdowns on 3 trips) versus the Saints’ failures (0 points on 2 trips) created an insurmountable 21-point advantage in a 7-point game.
For the 6-6 Rams, this victory keeps playoff hopes alive entering December. McVay’s halftime adjustments, Williams’ explosive running, and clutch defensive stops demonstrate the formula for success moving forward.
The 4-8 Saints face harder questions. Interim coach Rizzi’s honeymoon ended with exposed weaknesses: an offense that moves between the 20s but can’t finish, questionable red zone play-calling, and depth concerns magnified by injuries. Carr’s conservative approach (5.0 YPA) and Kamara’s inability to reach the end zone despite 112 yards symbolize an offense that works hard for minimal reward.
Data Sources: Official NFL Game Center, ESPN Box Scores, Pro Football Focus


