
Las Vegas Raiders vs Tampa Bay Buccaneers Match Player Stats (Dec 8 ,2024)
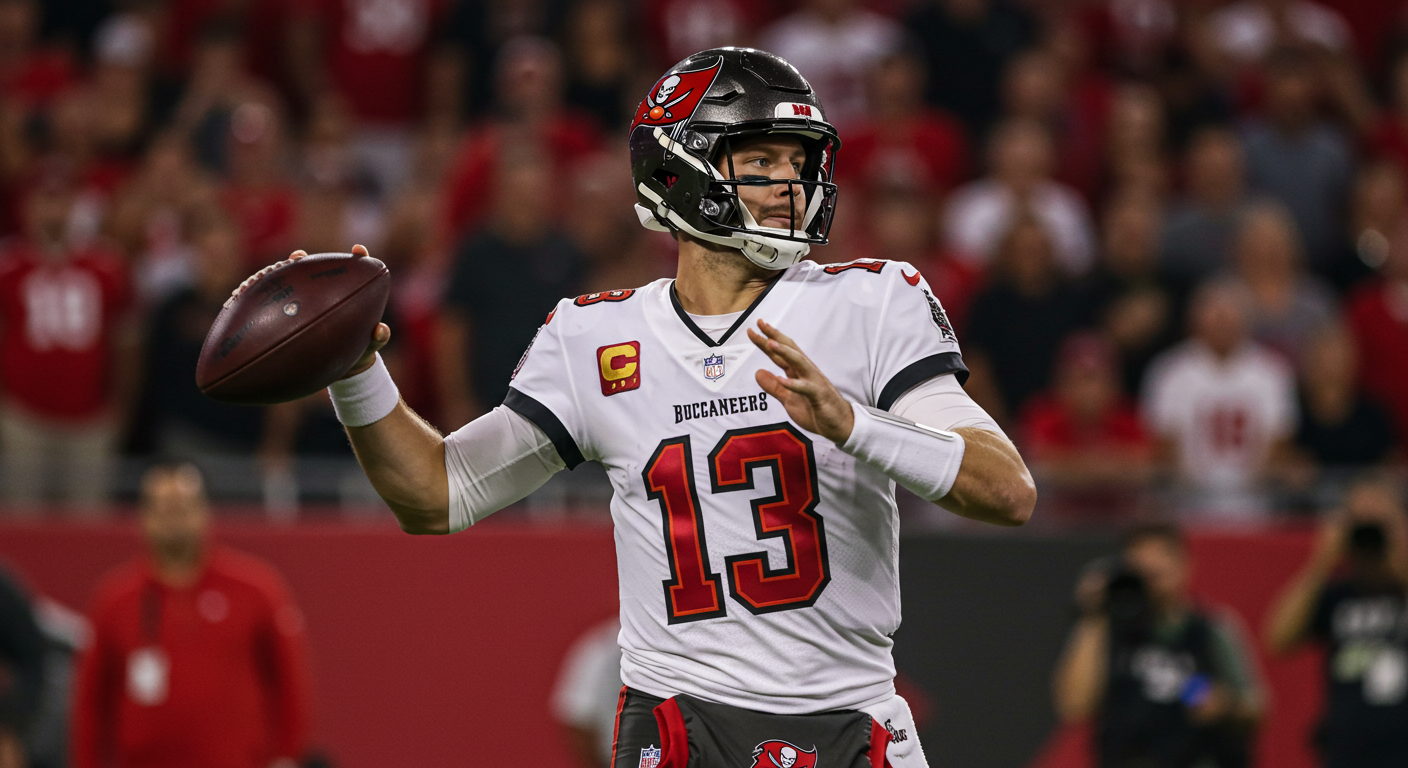
The December 8, 2024 clash between the Las Vegas Raiders and Tampa Bay Buccaneers at Raymond James Stadium ended 28-13 in favor of the home team. Tampa Bay’s red zone perfection and explosive plays overcame three turnovers, while Las Vegas failed to convert defensive opportunities into points.
Game Date: December 8, 2024
Venue: Raymond James Stadium, Tampa, FL
Attendance: 63,250
Game Highlights
• Baker Mayfield threw 3 TD passes, tying his career-high 28 for the season
• Rachaad White totaled 109 all-purpose yards with 2 touchdowns
• Tampa Bay converted all 3 red zone trips into touchdowns (100%)
• Las Vegas forced 3 turnovers but scored only 10 points off them
• Brock Bowers set NFL rookie tight end reception record
• Aidan O’Connell left with knee injury in third quarter
Quick Game Summary
| Category | Las Vegas Raiders | Tampa Bay Buccaneers |
|---|---|---|
| Final Score | 13 | 28 |
| Total Yards | 286 | 420 |
| Turnovers | 2 | 3 |
| Time of Possession | 31:30 | 28:30 |
| Red Zone Efficiency | 1/4 (25%) | 3/3 (100%) |
Statistical Leaders
- Passing: Baker Mayfield (TB) – 295 yards, 3 TDs, 2 INTs
- Rushing: Rachaad White (TB) – 90 yards, 1 TD
- Receiving: Cade Otton (TB) – 3 catches, 70 yards
First Quarter: Tampa Bay’s Fast Start
The Buccaneers dominated the opening quarter, outgaining Las Vegas 154-14 in total yards while building a 14-0 lead. Tampa Bay held an 11-1 advantage in first downs during this period.
Scoring Plays – First Quarter
- 8:07 – Jalen McMillan 15-yard TD reception from Baker Mayfield (McLaughlin PAT good)
- 3:52 – Rachaad White 5-yard TD reception from Mayfield (McLaughlin PAT good)
McMillan’s touchdown marked his first score since Week 1. White’s receiving touchdown placed him second all-time among Buccaneers running backs for career receiving touchdowns, behind only Mike Alstott.
Quarterback Performance Analysis
Statistical Breakdown
| Quarterback | Comp/Att | Yards | TD | INT | Rating | Sacks-Yards Lost |
|---|---|---|---|---|---|---|
| Baker Mayfield (TB) | 18/29 | 295 | 3 | 2 | 101.9 | 4-27 |
| Aidan O’Connell (LV) | 11/19 | 104 | 0 | 1 | 51.2 | 1-10 |
| Desmond Ridder (LV) | 12/18 | 101 | 0 | 0 | 81.0 | 1-0 |
Baker Mayfield’s third touchdown pass brought his season total to 28, matching his 2020 career high with Cleveland. His 295 yards came despite two interceptions and a lost fumble.
Aidan O’Connell exited at 1:23 of the third quarter with a knee injury. Coach Antonio Pierce’s post-game assessment: “doesn’t look good.”
Second Quarter: Raiders’ Defensive Stand
Las Vegas narrowed the gap to 14-10 by halftime through defensive pressure and opportunistic play.
Key Defensive Plays
- 13:40 – K’Lavon Chaisson intercepted Mayfield
- 12:35 – O’Connell fumbled the snap, Lavonte David recovered
- 11:19 – Amari Burney strip-sacked Mayfield, Tre’von Moehrig recovered
- 0:39 – Jack Jones intercepted Mayfield in the end zone, returned 24 yards
Moehrig’s fumble recovery marked the first by Las Vegas’ defense all season.
Scoring Plays – Second Quarter
- 9:21 – Aidan O’Connell 1-yard TD run (Carlson PAT good)
- 4:28 – Daniel Carlson 25-yard field goal
Running Game Statistics
Team Rushing Totals
- Tampa Bay: 26 carries, 152 yards (5.8 avg), 1 TD
- Las Vegas: 25 carries, 91 yards (3.6 avg), 1 TD
Individual Rushing Leaders
| Player | Team | Att | Yards | Avg | TD | Long |
|---|---|---|---|---|---|---|
| Rachaad White | TB | 17 | 90 | 5.3 | 1 | 13 |
| Sincere McCormick | LV | 15 | 78 | 5.2 | 0 | 29 |
| Sean Tucker | TB | 3 | 47 | 15.7 | 0 | 34 |
| Baker Mayfield | TB | 2 | 12 | 6.0 | 0 | 7 |
| Aidan O’Connell | LV | 6 | 6 | 1.0 | 1 | 4 |
Sean Tucker’s 34-yard burst in the fourth quarter set up a crucial Tampa Bay touchdown. Rachaad White finished with 109 all-purpose yards and two total touchdowns.
Third Quarter: Momentum Shifts
The scoreless third quarter featured Tampa Bay’s defense stepping up at crucial moments. With Las Vegas driving near midfield, Desmond Ridder replaced the injured O’Connell. The Raiders reached the Tampa Bay 25-yard line before Tykee Smith intercepted Ridder at the 7-yard line with 4:48 remaining, preserving Tampa Bay’s four-point lead.
Key Third Quarter Events
- O’Connell injury (1:23 remaining)
- Ridder enters at quarterback
- Smith’s red zone interception halts Las Vegas’ best scoring chance
- Raiders manage just 42 total yards in the quarter
Receiving Statistics and Impact
Complete Receiving Stats
| Player | Team | Rec | Yards | Avg | TD | Targets |
|---|---|---|---|---|---|---|
| Tampa Bay Buccaneers | ||||||
| Cade Otton | TB | 3 | 70 | 23.3 | 0 | 4 |
| Mike Evans | TB | 4 | 69 | 17.3 | 0 | 5 |
| Sterling Shepard | TB | 4 | 63 | 15.8 | 0 | 6 |
| Jalen McMillan | TB | 4 | 59 | 14.8 | 2 | 7 |
| Rachaad White | TB | 2 | 19 | 9.5 | 1 | 3 |
| Bucky Irving | TB | 1 | 15 | 15.0 | 0 | 1 |
| Las Vegas Raiders | ||||||
| Michael Mayer | LV | 7 | 68 | 9.7 | 0 | 9 |
| Jakobi Meyers | LV | 7 | 67 | 9.6 | 0 | 10 |
| Brock Bowers | LV | 3 | 49 | 16.3 | 0 | 5 |
| Sincere McCormick | LV | 2 | 11 | 5.5 | 0 | 3 |
Cade Otton’s 44-yard reception stood as Tampa Bay’s longest play. Mike Evans contributed a 32-yard catch where he hurdled defender Darnay Holmes. Brock Bowers’ three receptions pushed him past Mike Ditka’s 1961 record for rookie tight end catches.
Fourth Quarter: Tampa Bay Closes Strong
The Buccaneers outscored Las Vegas 14-3 in the final quarter to secure victory.
Scoring Sequence – Fourth Quarter
- 8:47 – Rachaad White 3-yard TD run (McLaughlin PAT good)
- 3:05 – Daniel Carlson 27-yard field goal
- 1:56 – Jalen McMillan 29-yard TD reception from Mayfield (McLaughlin PAT good)
White’s touchdown capped a 77-yard drive featuring Sean Tucker’s 34-yard run and Mike Evans’ 32-yard reception.
Defensive Performance
Team Defensive Statistics
- Tampa Bay: 2 sacks, 1 INT, 1 fumble recovery
- Las Vegas: 4 sacks, 2 INTs, 1 fumble recovery
Individual Defensive Leaders
| Player | Team | Tackles (Total/Solo) | Sacks | TFL | INT | Pass Deflections |
|---|---|---|---|---|---|---|
| Tre’von Moehrig | LV | 8/5 | 0.5 | 0 | 0 | 3 |
| Lavonte David | TB | 7/5 | 1.0 | 1 | 0 | 0 |
| Zyon McCollum | TB | 7/6 | 0.0 | 0 | 0 | 0 |
| Robert Spillane | LV | 7/5 | 0.0 | 0 | 0 | 0 |
| Darnay Holmes | LV | 7/4 | 1.0 | 1 | 0 | 1 |
Lavonte David anchored Tampa Bay’s defense without starters Antoine Winfield Jr. (left with injury), K.J. Britt, and Mike Edwards. His fumble recovery in the second quarter halted a Raiders drive.
Special Teams Contributions
Field Goal Performance
- Daniel Carlson (LV): 2/2 FG (25, 27 yards), 1/1 XP
- Chase McLaughlin (TB): 0/0 FG, 4/4 XP
Punting Statistics
- AJ Cole (LV): 4 punts, 44.3 avg, 51-yard long, 1 touchback
- Jack Browning (TB): 3 punts, 42.7 avg, 49-yard long
Browning made his NFL debut after being elevated from the practice squad one day prior.
Return Game Summary
| Returner | Team | KR | KR Yards | PR | PR Yards |
|---|---|---|---|---|---|
| Ameer Abdullah | LV | 2 | 59 | 2 | 30 |
| Sean Tucker | TB | 1 | 25 | 0 | 0 |
| Rakim Jarrett | TB | 1 | 23 | 0 | 0 |
| Trey Palmer | TB | 0 | 0 | 1 | 3 |
Critical Statistical Comparisons
Red Zone Efficiency – The Deciding Factor
- Tampa Bay: 3/3 (100%) – 21 points
- Las Vegas: 1/4 (25%) – 7 points
The 14-point differential in red zone scoring directly correlated to Tampa Bay’s 15-point victory margin.
Explosive Plays (30+ yards)
- Tampa Bay: 3 plays
- Cade Otton 44-yard reception
- Sean Tucker 34-yard run
- Mike Evans 32-yard reception
- Las Vegas: 0 plays
- Longest: McCormick 29-yard run, Mayer 29-yard reception
Third Down Performance
- Tampa Bay: 5/12 (41.7%)
- Las Vegas: 4/13 (30.8%)
Complete Turnover Details
| Time | Type | Player | Team | Result |
|---|---|---|---|---|
| Q2 13:40 | INT | K’Lavon Chaisson | LV | Drive ended with fumble |
| Q2 12:35 | Fumble | A. O’Connell | LV | Recovered by L. David |
| Q2 11:19 | Strip-Sack | A. Burney on Mayfield | LV | Led to LV touchdown |
| Q2 0:39 | INT | Jack Jones | LV | Prevented TB score |
| Q3 4:48 | INT | Tykee Smith | TB | Prevented LV score |
Team Records and Milestones
Tampa Bay Buccaneers (7-6)
- First place in NFC South
- Baker Mayfield: 28 TD passes (tied career high)
- Rachaad White: 2nd in franchise history for RB receiving TDs
Las Vegas Raiders (2-11)
- First defensive fumble recovery of season
- Brock Bowers: NFL rookie TE reception record
- 11th loss eliminates playoff contention
Game Officials
Crew Chief: Derick Bowers
Officials: Greg Meyer, Tab Slaughter, Dale Shaw, John Jenkins, Alan Eck, Derek Anderson
Network: CBS
Key Statistical Insights
Tampa Bay gained 420 yards on 59 plays (7.1 per play) while Las Vegas managed 286 yards on 64 plays (4.5 per play). This efficiency gap appeared throughout: first downs (21-16), passing yards per attempt (9.2-5.3), and rushing average (5.8-3.6).
The Raiders controlled possession for 31:30 compared to Tampa Bay’s 28:30, but their drives consistently stalled. Las Vegas averaged just 26 yards per drive compared to Tampa Bay’s 42 yards per drive.
External Game Coverage
Related Match Analysis
For more Raiders coverage, see their previous game against Carolina. For Buccaneers analysis, check their matchup with Kansas City.
Frequently Asked Questions
Who had the most receiving yards in the Raiders vs Buccaneers game?
Cade Otton led all receivers with 70 yards on 3 catches for Tampa Bay.
How many touchdowns did Baker Mayfield throw?
Baker Mayfield threw 3 touchdown passes – two to Jalen McMillan and one to Rachaad White.
What was the final score of Raiders vs Buccaneers?
Tampa Bay defeated Las Vegas 28-13 at Raymond James Stadium.
Did any players set records in this game?
Brock Bowers set the NFL rookie record for receptions by a tight end, while Baker Mayfield tied his career-high with 28 TD passes for the season.
When did Aidan O’Connell get injured?
O’Connell left the game with a knee injury at 1:23 of the third quarter.
Final Statistical Analysis
Las Vegas Raiders vs Tampa Bay Buccaneers match player stats from December 8, 2024 demonstrate the importance of red zone execution and explosive plays. Tampa Bay converted every red zone opportunity into touchdowns while generating three plays of 30+ yards. Las Vegas managed neither, settling for field goals in the red zone and failing to produce any explosive plays. The Buccaneers’ 7.1 yards per play efficiency overcame their three turnovers, while the Raiders’ four sacks and two interceptions produced just 10 points in another frustrating loss.


