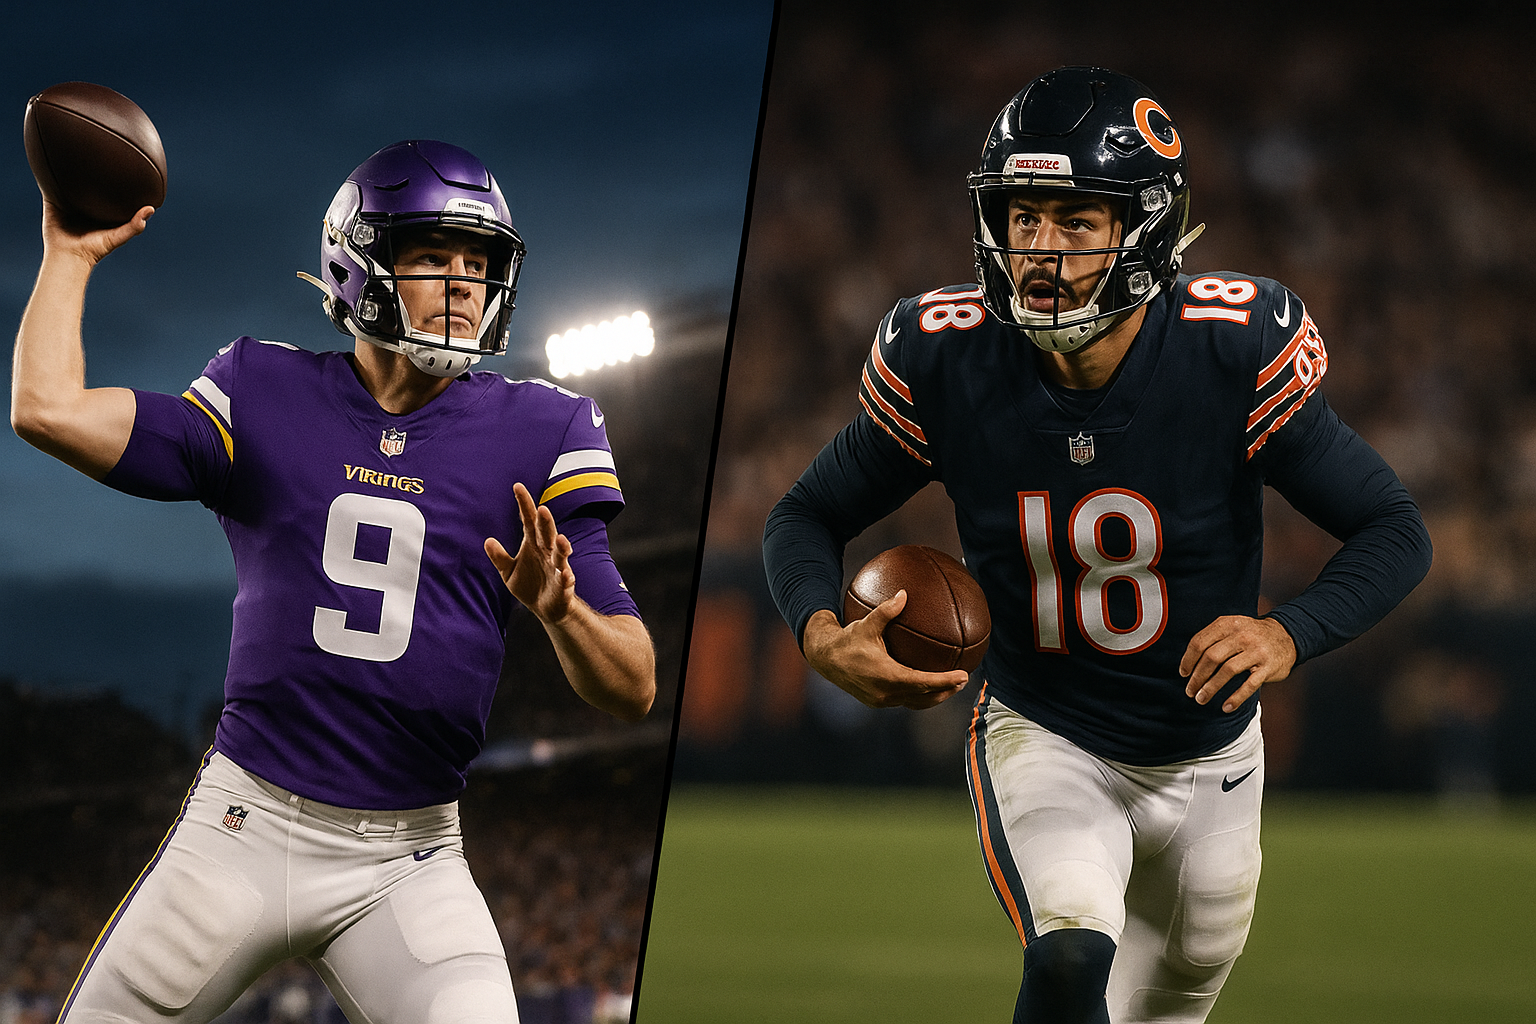
Chicago Bears vs Minnesota Vikings Match Player Stats (Sep 8, 2025)
Minnesota erased an 11-point fourth-quarter deficit to beat Chicago 27-24 at Soldier Field on September 8, 2025, in the Monday Night Football Week 1 opener. J.J. McCarthy threw three touchdown passes in the final period during his NFL debut, while the Bears committed 12 penalties for 127 yards in a game they controlled for three quarters.
Game at a Glance
Final Score: Vikings 27, Bears 24
Game Changer: Cairo Santos missed 50-yard field goal to open fourth quarter
Biggest Stat: Chicago penalized 12 times for 127 yards vs Minnesota’s 8 for 50
Historic Performance: McCarthy became first QB to throw two 10+ yard TD passes and rush for 10+ yard score in same fourth quarter
Attendance: 58,742 at Soldier Field
Conditions: 68 degrees, 38% humidity, 6 mph winds
Vegas Line: Vikings -1.5 (covered), Over/Under 43.5 (over by 7.5)
Table of Contents
Fourth Quarter Comeback Erases Chicago’s Dominance
The Bears controlled this game through three quarters. They led 17-6 after Nahshon Wright returned an interception 74 yards for a touchdown with 12:51 remaining in the third period. Chicago’s defense had held Minnesota to 0-for-8 on third down conversions. The Vikings offense looked helpless.
Then McCarthy flipped the script in 10 minutes and 34 seconds of game time.
How the Scoring Unfolded
| Quarter | Vikings | Bears |
|---|---|---|
| 1st | 0 | 7 |
| 2nd | 6 | 3 |
| 3rd | 0 | 7 |
| 4th | 21 | 7 |
| Final | 27 | 24 |
McCarthy’s fourth quarter production: 6-for-8, 87 yards, 2 TDs passing, 1 TD rushing.
His 13-yard strike to Justin Jefferson on third-and-5 broke Minnesota’s third down drought and gave the Vikings life. Three minutes later, he found Aaron Jones streaking down the right sideline for 27 yards and the go-ahead score. His 14-yard scramble with 2:53 remaining put the game away after Chicago had clawed back within three points.
The Vikings converted 3-of-4 third downs in the final quarter after going 0-for-8 through three periods. Chicago went 0-for-3 on third down in the fourth, unable to sustain drives during crunch time.
Despite being outgained 317 to 254 in total yards and surrendering possession for 32:53 compared to their 27:07, Minnesota found ways to win. Chicago’s self-inflicted wounds proved fatal. The game lasted 3 hours and 16 minutes in front of a crowd that watched their home team let victory slip away.
McCarthy’s Debut: Growth Through Adversity
J.J. McCarthy completed 13 of 20 passes for 143 yards with two touchdowns and one interception in his first NFL action. The 98.5 passer rating doesn’t capture the resilience required after throwing the pick-six that gave Chicago an 11-point cushion.
McCarthy’s Numbers
| Category | Stats |
|---|---|
| Completions/Attempts | 13/20 |
| Passing Yards | 143 |
| Touchdowns | 2 |
| Interceptions | 1 |
| Passer Rating | 98.5 |
| Rushing Attempts | 2 |
| Rushing Yards | 25 |
| Rushing TD | 1 |
| QBR | 52.5 |
| Sacks Taken | 3 |
| Times Hit | 2 |
The Michigan product missed his entire 2024 rookie season recovering from a knee injury after Minnesota selected him 10th overall. This marked his professional debut, played roughly 15 miles from La Grange Park where he grew up. The hometown pressure could have crushed him after the interception. Instead, he delivered during the comeback.
Breaking Down His Precision
His receivers didn’t drop a single pass all night. His 83.3% adjusted completion percentage shows he consistently put the ball in catchable locations despite pressure. The Vikings surrendered three sacks and six total pressures, but McCarthy’s 2.82-second average release time helped him avoid bigger trouble.
| Metric | McCarthy |
|---|---|
| Intended Air Yards | 137 |
| Completed Air Yards | 75 |
| Yards After Catch | 68 |
| Average Depth of Target | 6.9 |
| Adjusted Completion % | 83.3% |
| Drops | 0 |
| Drop % | 0.0% |
| Bad Throws | 3 |
| Bad Throw % | 15.0% |
| Average Time to Throw | 2.82 seconds |
His 15% bad throw rate demonstrates solid accuracy for a quarterback making his debut in a hostile environment against a defense that brought consistent pressure. Only three of his 20 attempts qualified as poorly thrown balls.
Vikings coach Kevin O’Connell told McCarthy at halftime that he would lead them to victory. The second-year signal caller proved his coach right by avoiding mistakes and making crucial throws during the fourth quarter surge.
Williams: Hot Start Fades Under Relentless Pressure
Caleb Williams opened the game on fire, completing his first 10 passes. That streak marked the best start by a Bears quarterback to open a season since at least 1978. He finished 21 of 35 for 210 yards with one passing touchdown and an 86.6 passer rating, adding 58 rushing yards and a touchdown on six carries.
The problem? He completed just 11 of his final 25 attempts as Minnesota’s defense adjusted.
Williams’ Complete Performance
| Category | Stats |
|---|---|
| Completions/Attempts | 21/35 |
| Passing Yards | 210 |
| Touchdowns | 1 |
| Interceptions | 0 |
| Passer Rating | 86.6 |
| Rushing Attempts | 6 |
| Rushing Yards | 58 |
| Rushing TD | 1 |
| Sacks Taken | 2 |
| Times Hit | 2 |
| Hurries | 7 |
The Pressure Problem
According to CBS Sports, defensive coordinator Brian Flores increased Minnesota’s blitz rate from 25% in the first half to 44% after halftime. Williams struggled to adjust.
| Metric | Williams |
|---|---|
| Intended Air Yards | 262 |
| Completed Air Yards | 133 |
| Yards After Catch | 77 |
| Average Depth of Target | 7.5 |
| Adjusted Completion % | 68.8% |
| Drops | 1 |
| Drop % | 2.9% |
| Bad Throws | 9 |
| Bad Throw % | 26.5% |
| Average Time to Throw | 3.39 seconds |
The 26.5% bad throw rate reflects a quarterback fighting to stay composed under duress. Nine of his 35 attempts qualified as poorly thrown balls, more than triple McCarthy’s total despite throwing 15 more passes.
The time to throw metric identifies another issue. Williams averaged 3.39 seconds before releasing the ball, compared to McCarthy’s 2.82 seconds. That extra 0.57 seconds gave Minnesota’s pass rushers more time to collapse the pocket and disrupt his rhythm.
The second-year quarterback’s 9-yard rushing touchdown in the first quarter showed his dual-threat ability. His scrambling kept drives alive throughout the night. But during the crucial fourth quarter, with Minnesota bringing extra pressure and Chicago needing accurate throws on third down, the mistakes mounted.
Ground Game Production: Physical Running Controls Fourth Quarter
Jordan Mason led all rushers with 68 yards on 15 carries, providing the physical presence Minnesota needed to control the final period. His 4.5 yards per carry average came the hard way, forcing defenders to finish tackles rather than getting easy stops at the line.
Rushing Performance Breakdown
| Player | Team | Attempts | Yards | Average | TD | Long | YBC | YAC | Broken Tackles |
|---|---|---|---|---|---|---|---|---|---|
| Jordan Mason | MIN | 15 | 68 | 4.5 | 0 | 19 | 27 | 41 | 0 |
| Caleb Williams | CHI | 6 | 58 | 9.7 | 1 | 13 | 56 | 2 | 0 |
| D’Andre Swift | CHI | 17 | 53 | 3.1 | 0 | 13 | 21 | 32 | 1 |
| Aaron Jones | MIN | 8 | 23 | 2.9 | 0 | 9 | 8 | 15 | 1 |
| J.J. McCarthy | MIN | 2 | 25 | 12.5 | 1 | 14 | 23 | 2 | 0 |
The Mason Factor
Mason generated 41 yards after contact on his 68 total yards. He averaged 1.8 yards before contact and 2.7 after, demonstrating his physical style that wore down Chicago’s defense. His crucial gains of 18 and 19 yards in the fourth quarter created scoring opportunities during Minnesota’s comeback.
The Vikings’ running back rotation kept both Mason and Jones fresh. Mason handled the early-down physical work, while Jones provided explosive plays in space as a receiver. Jones caught three passes for 44 yards, including the game-winning 27-yard touchdown that showed his dual-threat value.
Swift’s Struggles
Swift carried 17 times but averaged just 3.1 yards per attempt. In the first and fourth quarters combined, he managed zero yards on five carries. His 21 yards before contact versus 32 yards after contact shows he had to create on his own, breaking one tackle along the way. Chicago’s offensive line didn’t generate consistent push, and Swift couldn’t manufacture yards when the blocking broke down.
Williams’ 58 rushing yards on six carries (9.7 average) led Chicago’s ground game, but those yards came on scrambles rather than designed runs. During the fourth quarter, with the Bears needing traditional running game production to control the clock, Swift couldn’t deliver.
Receiving Performances: Clutch Catches Change Momentum
Vikings Pass Catchers
Justin Jefferson caught four passes for 44 yards and the crucial third-down touchdown that sparked Minnesota’s comeback. The performance moved him past Steve Jordan into fourth place on the Vikings’ all-time receiving list with 499 career catches.
| Player | Team | Targets | Receptions | Yards | Average | TD | Long | YBC | YAC | Broken Tackles |
|---|---|---|---|---|---|---|---|---|---|---|
| DJ Moore | CHI | 5 | 3 | 68 | 22.7 | 0 | 30 | 46 | 22 | 1 |
| Aaron Jones | MIN | 3 | 3 | 44 | 14.7 | 1 | 27 | 21 | 23 | 0 |
| Justin Jefferson | MIN | 7 | 4 | 44 | 11.0 | 1 | 17 | 32 | 12 | 1 |
| Olamide Zaccheaus | CHI | 7 | 4 | 42 | 10.5 | 0 | 16 | 21 | 21 | 0 |
| Rome Odunze | CHI | 9 | 6 | 37 | 6.2 | 1 | 17 | 35 | 2 | 0 |
| Cole Kmet | CHI | 4 | 1 | 31 | 31.0 | 0 | 31 | 31 | 0 | 0 |
Jefferson’s 10.0-yard average depth of target and one broken tackle highlighted his ability to create after the catch. His 13-yard touchdown reception on third-and-5 broke Minnesota’s drought and completely changed the game’s momentum. Chicago’s defense had shut him down for three quarters, but McCarthy found him for the score that sparked the rally.
T.J. Hockenson provided a reliable safety valve with three catches for 15 yards on four targets. Jalen Nailor’s 28-yard reception late in the first half helped Minnesota get in range for Will Reichard’s 59-yard field goal that kept them within striking distance at halftime.
Bears Pass Catchers
DJ Moore led all receivers with 68 yards on three catches, breaking one tackle and gaining 22 yards after the catch. But his fumble on the game’s final play sealed Chicago’s fate. His 18.4-yard average depth of target shows Williams tried attacking downfield through his number one receiver.
Rookie Rome Odunze led all pass catchers with nine targets, converting six for 37 yards and the game’s final touchdown. The 1-yard pass with 2:02 remaining cut the deficit to three and gave Chicago life. Most of his 35 yards before contact came on short routes where he couldn’t create separation for explosive plays. The rookie showed reliable hands and route running but needs to develop the burst to threaten defenses vertically.
Cole Kmet’s one catch went for 31 yards, all coming before contact. Williams found him wide open but couldn’t connect more frequently. Olamide Zaccheaus provided steady production with four catches for 42 yards on seven targets, moving the chains on underneath routes.
Before we examine how Minnesota’s defense made this comeback possible, consider McCarthy’s preparation for this moment. Our analysis of the Houston Texans vs Minnesota Vikings preseason game shows the quarterback competition that shaped Minnesota’s offense entering the regular season. The development process Kevin O’Connell implemented during August paid dividends during Monday night’s fourth quarter.
Defensive Performance: Pressure and Turnovers Define Outcome
“I don’t know if we win the football game unless you have Eric Wilson. Not only the blocked punt, but with just the way he goes in and he’s green-dotting and calling it. You want to see a prototype of a veteran guy that helps your football team win by any means necessary, it’s Eric Wilson.”
— Kevin O’Connell, Vikings Head Coach
Pass Rush Production
Javon Hargrave dominated in his Vikings debut, recording two sacks and three solo tackles. His pressure on Williams disrupted Chicago’s rhythm in the second half, forcing quick throws and inaccurate decisions.
| Player | Team | Total Pressures | Sacks | Hits | Hurries | Rush Snaps | Pressure Rate |
|---|---|---|---|---|---|---|---|
| Javon Hargrave | MIN | 3 | 2 | 1 | 0 | 32 | 9.4% |
| Jonathan Allen | MIN | 2 | 0 | 0 | 2 | 34 | 5.9% |
| Jonathan Greenard | MIN | 3 | 0 | 2 | 1 | 35 | 8.6% |
| Gervon Dexter | CHI | 1 | 1 | 1 | 0 | 13 | 7.7% |
| Dayo Odeyingbo | CHI | 3 | 1 | 2 | 0 | 19 | 15.8% |
| Tanoh Kpassagnon | CHI | 2 | 1 | 2 | 0 | 4 | 50.0% |
Kpassagnon’s 50% pressure rate came on limited snaps but shows his effectiveness in passing situations. His second-quarter sack of McCarthy stopped a Vikings drive and helped Chicago maintain control early.
Tackle Leaders and Coverage
Defensive Statistics
| Player | Team | Tackles | Solo | Sacks | TFL | QB Hits | PD | INT |
|---|---|---|---|---|---|---|---|---|
| Noah Sewell | CHI | 9 | 7 | 0 | 0 | 0 | 0 | 0 |
| Tremaine Edmunds | CHI | 7 | 3 | 0 | 0 | 0 | 1 | 0 |
| Josh Metellus | MIN | 6 | 4 | 0 | 0 | 0 | 0 | 0 |
| Javon Hargrave | MIN | 5 | 3 | 2 | 2 | 1 | 0 | 0 |
| Kevin Byard III | CHI | 5 | 5 | 0 | 0 | 0 | 0 | 0 |
| Jaquan Brisker | CHI | 5 | 4 | 0 | 0 | 0 | 0 | 0 |
| Andrew Van Ginkel | MIN | 5 | 3 | 0 | 1 | 0 | 2 | 0 |
| Ivan Pace Jr. | MIN | 5 | 2 | 0 | 0 | 0 | 0 | 0 |
Noah Sewell made nine tackles in his first career start, filling in for injured T.J. Edwards. The Oregon product showed strong instincts in the run game, finishing plays sideline to sideline.
The Wright Redemption
Nahshon Wright’s 74-yard interception return gave Chicago a 17-6 lead with 12:51 left in the third quarter. He jumped McCarthy’s route on third-and-8, picked off the pass in the left flat, and raced down the right sideline untouched for six points.
The cornerback redeemed himself after committing a costly 42-yard pass interference penalty earlier in the game. Pro Football Focus gave Wright an 85.7 grade, the highest among all defenders.
| Player | Team | Targets | Receptions | Yards | Completion % | INT | PD | Rating Allowed |
|---|---|---|---|---|---|---|---|---|
| Byron Murphy Jr. | MIN | 7 | 5 | 64 | 71.4% | 0 | 0 | 139.3 |
| Nahshon Wright | CHI | 3 | 1 | 28 | 33.3% | 1 | 1 | 29.2 |
| Tyrique Stevenson | CHI | 3 | 1 | 17 | 33.3% | 0 | 1 | 53.5 |
| Tremaine Edmunds | CHI | 4 | 4 | 27 | 100% | 0 | 1 | 94.8 |
| Noah Sewell | CHI | 4 | 4 | 46 | 100% | 0 | 0 | 154.2 |
Byron Murphy’s 139.3 passer rating allowed hurt Minnesota in coverage. Quarterbacks targeted him seven times successfully, completing five passes for 64 yards. Sewell’s perfect completion rate in coverage shows receivers found success against the rookie linebacker in passing situations.
Wright’s interception and pass deflection offset the one completion he allowed. His 29.2 passer rating allowed ranks among the game’s best marks.
Eric Wilson: Veteran Leadership Takes Over
Blake Cashman departed in the second quarter with a hamstring injury that required an MRI the following day. Eric Wilson stepped in and finished with five tackles, two assists, one quarterback hurry, and the play that flipped momentum.
On a third-quarter punt, Wilson tipped the ball at the line, causing it to travel just 25 yards instead of pinning Minnesota deep. That field position change led directly to a Vikings scoring opportunity.
Kevin O’Connell’s post-game comments captured Wilson’s impact: “I don’t know if we win the football game unless you have Eric Wilson. Not only the blocked punt, but with just the way he goes in and he’s green-dotting and calling it. You want to see a prototype of a veteran guy that helps your football team win by any means necessary, it’s Eric Wilson.”
Pro Football Focus gave Wilson a 79.9 grade for his performance, validating the coach’s praise. The veteran linebacker’s experience running the defense kept Minnesota’s scheme intact despite losing their starting middle linebacker.
Special Teams: Kicking Makes the Difference
The Reichard Record, The Santos Miss
Will Reichard converted both field goal attempts, including a 59-yarder as time expired in the first half. The kick tied a Soldier Field record and kept Minnesota within four points entering halftime. He also made his lone extra point attempt.
| Kicker | Team | FG Made/Attempts | Long | XP Made/Attempts | Points |
|---|---|---|---|---|---|
| Will Reichard | MIN | 2/2 | 59 | 1/1 | 7 |
| Cairo Santos | CHI | 1/2 | 42 | 3/3 | 6 |
Cairo Santos missed a 50-yard field goal wide right on the first play of the fourth quarter. Minnesota immediately drove for a touchdown on the ensuing possession. Had Santos connected, Chicago would have led 20-6 with a full quarter to play. Instead, the Vikings seized momentum and never looked back.
Punting and Returns Create Field Position Advantages
| Punter | Team | Punts | Yards | Average | Net Average | Inside 20 | Long | Touchbacks |
|---|---|---|---|---|---|---|---|---|
| Ryan Wright | MIN | 7 | 333 | 47.6 | 33.0 | 0 | 54 | 0 |
| Tory Taylor | CHI | 6 | 266 | 44.3 | 33.0 | 1 | 56 | 0 |
Both punters averaged 33.0 net yards despite Wright’s higher gross average. Taylor placed one punt inside the 20-yard line, but Wilson’s tip negated another opportunity for good placement.
Return Game Performance
| Player | Team | Type | Returns | Yards | Average | Long |
|---|---|---|---|---|---|---|
| Myles Price | MIN | Punt | 4 | 68 | 17.0 | 22 |
| Ty Chandler | MIN | Kick | 3 | 84 | 28.0 | 33 |
| Devin Duvernay | CHI | Punt | 4 | 37 | 9.3 | 22 |
| Luther Burden III | CHI | Kick | 1 | 44 | 44.0 | 44 |
Myles Price’s 17.0-yard punt return average provided excellent field position throughout. Minnesota averaged just 6.8 yards per punt return in 2024 with a season long of 15 yards, making Price’s performance a dramatic upgrade in the return game.
Penalties: Self-Inflicted Wounds Prove Fatal
Chicago committed 12 penalties for 127 yards, their most flags since November 8, 2021. Minnesota drew eight penalties for 50 yards.
The Most Costly Infractions:
The 42-yard pass interference on Nahshon Wright at 15:00 of the second quarter helped Minnesota get in field goal range. Justin Skule’s 10-yard offensive holding at 5:52 of the second quarter negated Jordan Mason’s run. Darnell Wright’s 10-yard offensive holding at 0:51 of the third quarter nullified a 12-yard Swift run that would have moved Chicago into Minnesota territory.
The penalty that decided the game came at 9:52 of the fourth quarter. Tyrique Stevenson committed pass interference on third-and-1, giving Minnesota a first down at the Chicago 27 instead of forcing a punt. Two plays later, McCarthy found Jones for the go-ahead touchdown.
Ben Johnson acknowledged post-game that “we made too many mistakes there late in the game, myself included.” The first-year head coach learned a harsh lesson about discipline in crucial moments.
Pass Protection: Pressure Up Front Determines Outcome
Minnesota’s offensive line allowed six total pressures on 25 pass-blocking snaps, a 24% pressure rate. Justin Skule struggled most at left tackle, allowing four pressures including two sacks for a 16% pressure rate. On the opposite side, Brian O’Neill delivered a perfect performance with zero pressures allowed.
Ryan Kelly, Will Fries, and Donovan Jackson held strong in the interior, combining for just two total pressures on 75 combined snaps. This interior stability gave McCarthy clean pockets on crucial throws.
Key Pass Protection Numbers
| Player | Team | Position | Pressures Allowed | Sacks | Pressure Rate |
|---|---|---|---|---|---|
| Justin Skule | MIN | LT | 4 | 2 | 16.0% |
| Brian O’Neill | MIN | RT | 0 | 0 | 0.0% |
| Interior Three (Kelly/Fries/Jackson) | MIN | C/G | 2 | 0 | 2.7% |
Chicago’s offensive line allowed 11 pressures on 43 pass-blocking snaps, a 25.6% pressure rate. Drew Dalman and the guards shouldered most of the blame as Minnesota’s interior defensive line, led by Hargrave’s dominance, controlled the line of scrimmage in the second half.
Brian O’Neill’s perfect pass protection performance gave McCarthy a clean right side to work with. During pressure situations, McCarthy could confidently step up and to his right knowing O’Neill had secured the edge.
Third Down: The Critical Stat That Explains Everything
Both teams converted 3-for-12 on third down attempts. The timing of those conversions determined the game’s outcome. Chicago held Minnesota to 0-for-8 through three quarters before the Vikings converted three straight in the fourth.
| Team | Q1 | Q2 | Q3 | Q4 | Total |
|---|---|---|---|---|---|
| Vikings | 0/2 | 0/3 | 0/3 | 3/4 | 3/12 |
| Bears | 1/3 | 1/4 | 1/2 | 0/3 | 3/12 |
McCarthy’s 13-yard touchdown to Jefferson on third-and-5 broke Minnesota’s drought with 12:13 remaining. The Vikings converted their next two third downs on the go-ahead scoring drive. Chicago went 0-for-3 on third down in the fourth quarter, unable to sustain drives while trailing by a touchdown.
The third down battle perfectly captures this game. Chicago won the statistic for three quarters and built a comfortable lead. Minnesota won it during the final period and came away with victory.
Fourth Quarter Explosion: Complete Statistical Domination
The Vikings outgained Chicago 169-63 in the final period, converting 3-of-4 third downs while racking up nine first downs to Chicago’s seven. This Week 1 Monday Night Football game will be remembered for Minnesota’s ability to flip the script in just 15 minutes of game action.
Minnesota’s Three Scoring Drives:
First touchdown drive (12:13 remaining): 6 plays, 60 yards, 2:42 (Jefferson 13-yard pass)
Go-ahead touchdown drive (9:46 remaining): 3 plays, 50 yards, 0:51 (Jones 27-yard pass)
Clinching touchdown drive (2:53 remaining): 9 plays, 68 yards, 4:31 (McCarthy 14-yard run)
Each drive featured different aspects of Minnesota’s offense. The first featured McCarthy’s accuracy under pressure. The second demonstrated his ability to strike quickly after Chicago’s defense broke down. The third showed his capability to grind out first downs and convert third downs during a crucial stretch.
Final Quarter Comparison
| Category | Vikings | Bears |
|---|---|---|
| Total Yards | 169 | 63 |
| First Downs | 9 | 7 |
| Third Down | 3/4 | 0/3 |
| Time of Possession | 10:34 | 4:26 |
| Points | 21 | 7 |
Minnesota controlled the ball for 10:34 in the final quarter, nearly 2.5 times longer than Chicago’s 4:26. That possession advantage kept Williams on the sideline and the Bears defense on the field. Fatigue set in. Penalties mounted. The collapse became complete.
Advanced Metrics: Efficiency Differences
Expected Points Added
| Team | Offense | Defense | Special Teams | Total |
|---|---|---|---|---|
| Bears | -1.47 | 6.40 | -4.66 | -1.00 |
| Vikings | -6.40 | 1.47 | 4.66 | 1.00 |
Minnesota’s offense posted negative EPA until the fourth quarter, when McCarthy’s efficiency skyrocketed. The Vikings defense made crucial stops during crunch time, while their special teams unit provided consistent field position advantages through Price’s returns and Reichard’s big leg.
Chicago’s offense started hot but stalled at crucial moments. Their defense kept them in the game for three quarters before fatigue and penalties caught up. The special teams unit’s negative EPA came primarily from Santos’s missed field goal and Duvernay’s pedestrian punt return average.
Success Rate and Explosive Plays
| Team | Avg Yards per Play | Success Rate | Explosive Play Rate |
|---|---|---|---|
| Vikings | 5.2 | 38% | 14.3% |
| Bears | 5.0 | 41% | 15.9% |
Despite similar efficiency numbers, Minnesota converted explosive plays into points in scoring situations while Chicago’s came at less opportune times. The context of big plays occurred mattered more than the raw totals.
Drive Efficiency: Maximizing Limited Opportunities
| Team | Possessions | Points per Drive | Yards per Drive | Plays per Drive |
|---|---|---|---|---|
| Vikings | 11 | 1.8 | 18.1 | 4.6 |
| Bears | 11 | 1.4 | 22.1 | 6.1 |
Chicago averaged more yards per drive and more plays per possession yet scored fewer points per drive. The Vikings maximized their opportunities, especially late. The Bears moved the ball between the 20-yard lines but couldn’t finish drives with touchdowns.
Time of Possession vs. Scoring Efficiency
| Team | TOP | Plays | Total Yards | Points | Points per Minute |
|---|---|---|---|---|---|
| Bears | 32:53 | 63 | 317 | 24 | 0.73 |
| Vikings | 27:07 | 49 | 254 | 27 | 1.00 |
Minnesota scored roughly one point per minute of possession. Chicago needed nearly 90 seconds to generate each point. The Vikings made every possession count, while the Bears burned clock without finishing drives.
Red Zone Execution: Perfect Efficiency in Critical Areas
Both teams converted all their red zone opportunities into points, but Minnesota’s came at more crucial moments.
| Team | Attempts | TDs | FGs | Success Rate |
|---|---|---|---|---|
| Vikings | 3 | 2 | 1 | 100% |
| Bears | 2 | 2 | 0 | 100% |
The Vikings’ two red zone touchdowns came in the fourth quarter during their comeback. Chicago’s touchdowns came in the first quarter (Williams scramble) and fourth quarter (Odunze catch with 2:02 left). The latter arrived too late to change the outcome.
Playing Time Distribution Reveals Coaching Strategies
Key Snap Count Insights:
Minnesota rotated running backs perfectly to keep both fresh. Jordan Mason played 30 snaps (54%), Aaron Jones played 28 snaps (50%). This balance allowed both to contribute during the fourth quarter rally.
Justin Jefferson played 55 of 56 offensive snaps (98%), staying on the field despite limited production for three quarters. Kevin O’Connell’s patience was rewarded with the critical third-down touchdown.
For Chicago, Rome Odunze’s 63 snaps (94% in his debut) shows the coaching staff’s confidence in the rookie receiver. D’Andre Swift played 54 snaps (81%) but couldn’t produce despite heavy usage.
The defensive snap counts tell another part of the game. Isaiah Rodgers, Josh Metellus, and Theo Jackson played all 67 defensive snaps for Minnesota. Chicago’s depleted secondary (missing Jaylon Johnson and Kyler Gordon) showed its weakness as McCarthy found rhythm in the fourth quarter.
Injuries Affecting Both Rosters
Blake Cashman’s second-quarter hamstring injury forced Eric Wilson into extended action. Wilson’s veteran presence and special teams play may have saved Minnesota’s season in Week 1.
Jeff Okudah exited after the final play being evaluated for a concussion, leaving Minnesota thin at cornerback heading into Week 2.
Chicago played without three defensive starters: T.J. Edwards (hamstring), Jaylon Johnson (calf, groin), and Kyler Gordon (hamstring). The absences showed late as Minnesota’s offense found rhythm against backup defensive backs. Noah Sewell performed admirably in Edwards’ absence, but the lack of veteran presence in the secondary proved costly.
Coaching Decisions Under Scrutiny
Ben Johnson’s aggressive fourth-down decision in the second quarter backfired. Facing fourth-and-3 from the Minnesota 24, Williams threw incomplete. Three points left on the field early proved costly with Santos later missing from 50 yards.
Kevin O’Connell’s halftime adjustments turned the game. According to Sports Illustrated, defensive coordinator Brian Flores ramped up blitz packages in the second half. The increased pressure forced Williams into rushed decisions and inaccurate throws.
The decision to rotate Mason and Jones perfectly illustrates O’Connell’s experience. Mason’s physical style softened Chicago’s defense through three quarters. Jones then provided explosive plays in space after the defense was worn down. The complementary approach worked exactly as designed.
For context on the quarterback competitions shaping the 2025 season, our analysis of NFL quarterback battles examines the league-wide trend of young signal callers taking over starting roles. McCarthy’s performance validated Minnesota’s decision to hand him the job despite missing his rookie year.
Pro Football Focus Performance Grades
Top Offensive Performers
| Player | Team | Position | Grade |
|---|---|---|---|
| Braxton Jones | CHI | T | 76.8 |
| Caleb Williams | CHI | QB | 73.3 |
| Ryan Kelly | MIN | C | 72.6 |
| Darnell Wright | CHI | T | 71.5 |
| Olamide Zaccheaus | CHI | WR | 71.1 |
Chicago’s tackles graded well despite the loss, showing solid pass protection fundamentals. Kelly’s 72.6 grade demonstrates clean work from the center position, anchoring Minnesota’s interior line.
Top Defensive Performers
| Player | Team | Position | Grade |
|---|---|---|---|
| Nahshon Wright | CHI | CB | 85.7 |
| Jay Ward | MIN | S | 80.9 |
| Eric Wilson | MIN | LB | 79.9 |
| Tremaine Edmunds | CHI | LB | 75.9 |
| Josh Metellus | MIN | S | 75.8 |
Wright’s 85.7 grade led all defenders, justified by his pick-six and strong coverage work. Wilson’s 79.9 grade validates O’Connell’s post-game praise of the veteran’s impact stepping in for the injured Cashman.
These individual grades measure every snap rather than just highlight plays. But McCarthy’s fourth quarter performance in this Week 1 Monday Night Football clash transcends single-game grading systems.
Historic Achievement: McCarthy Joins Elite Company
No quarterback in NFL history had thrown two touchdown passes of at least 10 yards and rushed for a touchdown of at least 10 yards in a single fourth quarter before Monday night. McCarthy accomplished this feat in his professional debut, in his hometown, after throwing a pick-six that gave the opponent an 11-point lead.
The mental fortitude required to bounce back from that interception and deliver three crucial scores separates good quarterbacks from great ones. His 83.3% adjusted completion percentage suggests accuracy won’t be an issue going forward.
The question facing Minnesota becomes consistency. Can McCarthy replicate this fourth-quarter production over full 60-minute performances? Week 1 provided encouraging signs despite three quarters of struggle.
What Week 2 Requires: Adjustments Both Teams Must Make
Chicago’s Urgent Needs
The Bears must address their penalty issues immediately. Twelve flags for 127 yards won’t beat anybody, regardless of talent level. Ben Johnson has to instill discipline without crushing the aggressive mindset that made his Detroit offenses explosive.
Williams needs to improve his decision-making under pressure. His 26.5% bad throw rate and 3.39-second average time to throw both require work. Defensive coordinators will study Monday’s tape and bring similar pressure schemes, knowing Williams struggled against delayed blitzes and stunts.
The offensive line must provide better protection. Allowing 11 pressures on 43 pass-blocking snaps puts Williams in constant danger. The interior three (Dalman, Thuney, Jackson) need to handle defensive tackles better in one-on-one situations.
Minnesota’s Development Priorities
McCarthy proved he can handle prime time pressure in his hometown. The Vikings now need him to sustain success over four quarters rather than one explosive period. Early-game efficiency will determine if Minnesota can compete with elite teams.
The defense must start faster. Holding opponents scoreless for one quarter won’t work against better offenses than Chicago’s penalty-plagued attack. Defensive coordinator Brian Flores found the right adjustments at halftime, but elite teams won’t give him 30 minutes to make corrections.
Justin Skule’s pass protection issues need immediate attention. His 16% pressure rate and two sacks allowed put McCarthy in danger too often. The offensive line must tighten up before facing tougher defensive fronts in coming weeks.
Complete Statistical Summary
| Category | Vikings | Bears |
|---|---|---|
| First Downs | 14 | 20 |
| Total Yards | 254 | 317 |
| Passing Yards | 134 | 198 |
| Rushing Yards | 120 | 119 |
| Turnovers | 1 | 1 |
| Penalties | 8-50 | 12-127 |
| Time of Possession | 27:07 | 32:53 |
| Third Down | 3/12 | 3/12 |
| Fourth Down | 0/0 | 0/1 |
| Red Zone | 2/3 | 2/2 |
Minnesota’s 1-0 start continues their recent success in this NFC North rivalry. Chicago’s 0-1 record reflects the growing pains of a new coaching regime under Ben Johnson, who made his NFL head coaching debut in this Week 1 Monday Night Football contest.
The game came down to execution in crucial moments. McCarthy converted during the comeback. Williams showed flashes of brilliance but couldn’t maintain accuracy under sustained pressure. Chicago’s penalties and missed opportunities proved too much to overcome despite statistical advantages in yards and possession time.
The Vikings demonstrated the championship characteristic every contender needs: the ability to win games they probably should have lost. The Bears showed they can compete but haven’t yet learned how to finish. Week 1 provided both teams valuable lessons for the 16 games remaining on their schedules.