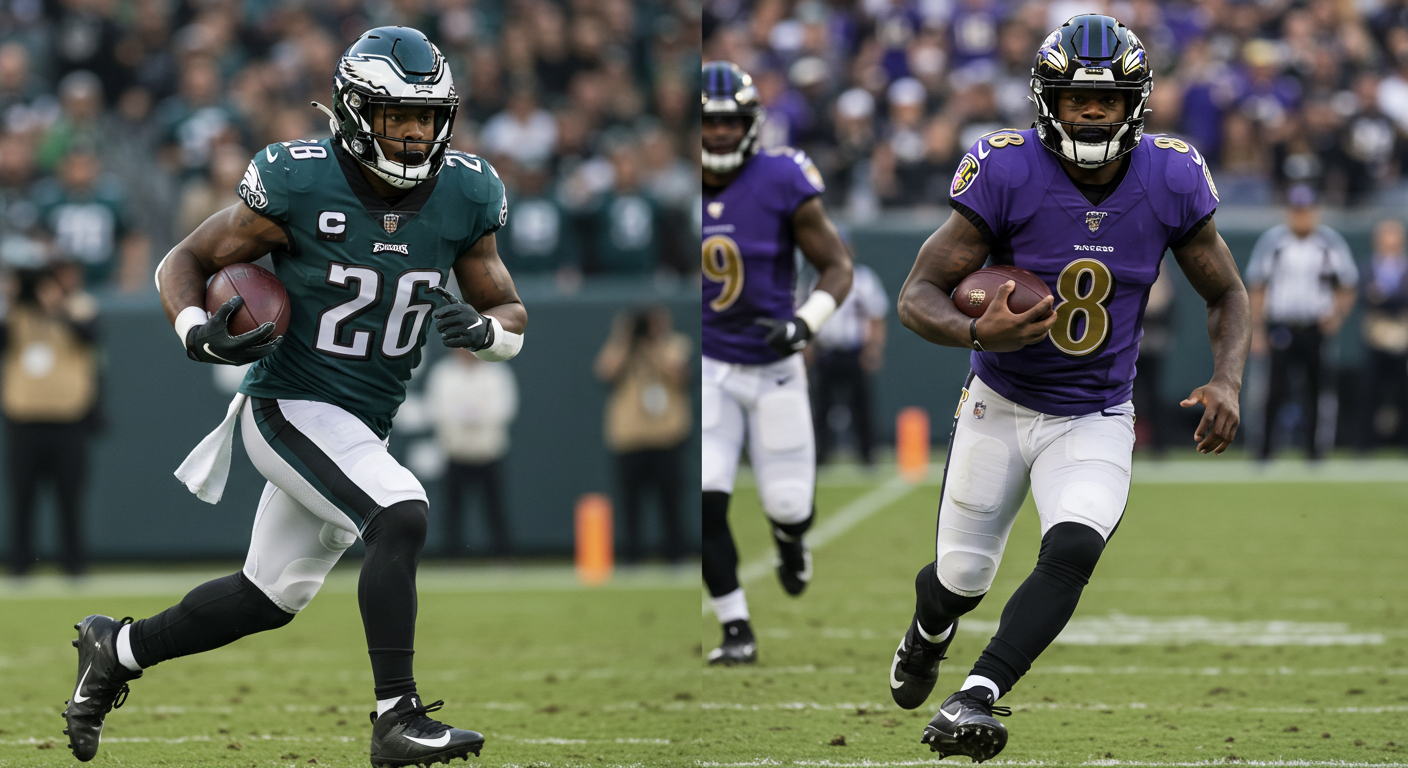
Philadelphia Eagles vs Baltimore Ravens Match Player Stats (Dec 1, 2024)
Philadelphia Eagles defeated Baltimore Ravens 24-19 on December 1, 2024, at M&T Bank Stadium. Jalen Hurts passed for 118 yards and one touchdown, Saquon Barkley rushed for 107 yards and a score, while Justin Tucker’s three missed kicks proved decisive in a game where the Eagles gained 120 fewer yards but won by five points.
The victory extended Philadelphia’s winning streak to eight games and improved their record to 10-2. Baltimore fell to 8-5 despite controlling possession for 33:51 compared to Philadelphia’s 26:09. This comprehensive breakdown examines every statistical category that separated these playoff contenders.
Table of Contents
Quick Stats Summary
Game-Deciding Factors
- Red Zone Efficiency: PHI 66.7% (2/3 TDs) vs BAL 40.0% (2/5 TDs)
- Special Teams: Tucker missed 2 FGs + 1 XP = 7 points left on field
- Sacks Differential: Baltimore lost 31 yards on 3 sacks vs Philadelphia’s 6 yards on 2 sacks
- Fourth Quarter: Barkley’s 25-yard TD run at 7:56 sealed the game
Game Information and Context
Final Score: Philadelphia 24, Baltimore 19
Date: Sunday, December 1, 2024
Location: M&T Bank Stadium, Baltimore, Maryland
Kickoff: 4:25 PM EST
Attendance: 71,344
Weather: 41°F, outdoors, 41% humidity, wind 7 mph
Surface: Natural grass
Duration: 3:05
Network: CBS (National broadcast)
Betting Results:
- Spread: Baltimore -3.0 (Philadelphia covered as underdogs)
- Over/Under: 51.0 (Under hit with 43 combined points)
Officials: Referee Craig Wrolstad (#4) and his crew included umpire Steven Woods, down judge Danny Short, line judge Brett Bergman, field judge Jeff Shears, side judge Frank Steratore, and back judge Rich Martinez.
Standings Entering Game: Philadelphia arrived at 9-2, leading the NFC East by 2.5 games over Washington. Baltimore sat at 8-4, just half a game behind Pittsburgh in the tight AFC North race.
Baltimore won the coin toss and deferred, giving Philadelphia the opening possession.
Injuries That Shaped the Matchup
Understanding who missed time helps explain why certain players carried heavier workloads.
Philadelphia Inactive:
- WR DeVonta Smith (hamstring) – Their top receiver ruled out before kickoff
Philadelphia In-Game:
- S Reed Blankenship (concussion) – Exited in Q3 after 51 snaps, replaced by Tristin McCollum
- WR Britain Covey (neck) – Left during the game
- TE Dallas Goedert (knee) – Briefly sidelined but returned to finish with 3 catches for 35 yards
Baltimore In-Game:
- S Kyle Hamilton (concussion protocol) – Cleared to return and played all 56 defensive snaps
- WR Rashod Bateman (knee) – Lost during the game, limiting receiving depth
- S Sanoussi Kane (hamstring) – Ruled out
Smith’s absence forced Philadelphia to lean more heavily on A.J. Brown, who absorbed extra coverage and still produced. Baltimore’s loss of Bateman reduced their ability to stretch the field beyond Zay Flowers.
How the Scoring Unfolded
| Quarter | Time | Team | Scoring Play | Score |
|---|---|---|---|---|
| Q1 | 9:21 | BAL | Tucker 34-yard FG (7 plays, 51 yards, 3:49) | BAL 3-0 |
| Q1 | 3:49 | BAL | Andrews 14-yard TD from Jackson, XP failed (8 plays, 82 yards, 4:38) | BAL 9-0 |
| Q2 | 8:04 | PHI | Goedert 17-yard TD from Hurts, Elliott XP (6 plays, 49 yards, 2:51) | PHI 7-9 |
| Q2 | 2:00 | PHI | Hurts 1-yard TD run, Elliott XP (9 plays, 68 yards, 4:02) | PHI 14-9 |
| Q2 | 0:03 | BAL | Tucker 50-yard FG (8 plays, 27 yards, 1:57) | PHI 14-12 |
| Q4 | 7:56 | PHI | Barkley 25-yard TD run, Elliott XP (7 plays, 71 yards, 3:24) | PHI 21-12 |
| Q4 | 1:03 | PHI | Elliott 35-yard FG (11 plays, 25 yards, 5:08) | PHI 24-12 |
| Q4 | 0:03 | BAL | Likely 11-yard TD from Jackson, Tucker XP (7 plays, 70 yards, 1:00) | PHI 24-19 |
Quarter Breakdown:
- Q1: BAL 9, PHI 0 (Tucker’s missed XP after Andrews TD was first warning sign)
- Q2: BAL 3, PHI 14 (Hurts orchestrated back-to-back TD drives)
- Halftime: PHI 14-12
- Q3: BAL 0, PHI 0 (Tucker missed two field goals from 47 and 53 yards)
- Q4: BAL 7, PHI 10 (Barkley’s TD run proved decisive)
The third quarter was pivotal. Baltimore controlled possession for 12 of 15 minutes without scoring a single point, squandering their best opportunity to regain control.
Team Statistics: Volume vs Efficiency
| Category | Philadelphia | Baltimore |
|---|---|---|
| Total Yards | 252 | 372 |
| First Downs | 17 | 24 |
| Passing Yards | 112 | 206 |
| Rushing Yards | 140 | 166 |
| Yards Per Play | 4.7 | 5.2 |
| Total Plays | 54 | 71 |
| Time of Possession | 26:09 | 33:51 |
| Third Down Conversions | 4-12 (33.3%) | 6-15 (40.0%) |
| Fourth Down Conversions | 1-1 (100%) | 1-2 (50.0%) |
| Red Zone Touchdowns | 2-3 (66.7%) | 2-5 (40.0%) |
| Turnovers | 0 | 0 |
| Penalties | 8-55 | 4-20 |
| Sacks Against | 2-6 | 3-31 |
Baltimore dominated traditional metrics but couldn’t convert advantages into points. The Ravens gained 120 more yards and held the ball nearly eight minutes longer, yet lost by five points. This disconnect between volume and results came down to three factors: red zone execution, special teams failures, and costly sacks at critical moments.
Philadelphia’s red zone touchdown rate of 66.7% crushed Baltimore’s 40% efficiency. That 26.7% gap correlates directly to the final margin. Similar patterns emerged earlier this season when Tampa Bay defeated Atlanta 23-20 despite being outgained by 98 yards, with the Buccaneers converting red zone chances while the Falcons settled for field goals and missed opportunities.
Jalen Hurts: Precision Over Production
Hurts didn’t compile gaudy numbers, but his efficiency in critical moments won the game.
| Stat | Total |
|---|---|
| Completions/Attempts | 11/19 (57.9%) |
| Passing Yards | 118 |
| Passing Touchdowns | 1 |
| Interceptions | 0 |
| Passer Rating | 93.8 |
| Sacks Taken | 2 (6 yards lost) |
| Rush Attempts | 9 |
| Rush Yards | 29 |
| Rush Touchdowns | 1 |
Advanced Metrics:
- Average Depth of Target: 7.3 yards
- Completed Air Yards: 66 (56.0% of passing total)
- Yards After Catch: 52 (44.0% of passing total)
- Bad Throws: 3
- Receiver Drops: 1
Hurts started cold, completing just one of his first five attempts. Then everything clicked. He connected on eight of his next nine passes for 86 yards, orchestrating consecutive touchdown drives that erased a 9-0 deficit and gave Philadelphia a lead they never surrendered.
His 17-yard touchdown strike to Dallas Goedert at 8:04 in the second quarter came off perfectly executed play-action. Two minutes later, he powered in from one yard out on the “Brotherly Shove” to make it 14-9. Both scoring drives showcased his ability to operate efficiently within the structure of the offense.
After halftime, Hurts protected the football and converted when necessary. Zero turnovers. Zero panic. Just execution when the game hung in the balance.
Who Hurts Targeted
The receiving corps stepped up with DeVonta Smith sidelined, though production remained concentrated among a few key targets.
| Player | Targets | Catches | Yards | Avg | Long | TD | Rating |
|---|---|---|---|---|---|---|---|
| A.J. Brown | 6 | 5 | 66 | 13.2 | 15 | 0 | 112.5 |
| Dallas Goedert | 4 | 3 | 35 | 11.7 | 17 | 1 | 140.6 |
| Saquon Barkley | 4 | 2 | 10 | 5.0 | 5 | 0 | 56.2 |
| Jahan Dotson | 1 | 1 | 7 | 7.0 | 7 | 0 | 95.8 |
Brown absorbed extra attention from Baltimore’s secondary and still caught five of six targets. His 14.7-yard average depth of target showed Philadelphia attacked vertically despite the conditions. Multiple third-down conversions kept drives alive when the offense needed to sustain possession.
Goedert’s touchdown grab was his biggest contribution, but his three catches on four targets provided consistent production from the tight end position. With an average depth of target at 5.8 yards, he worked the underneath areas and gave Hurts reliable options on critical downs.
Saquon Barkley Grinds Down Elite Defense
Barkley carried 23 times for 107 yards and one touchdown (4.7 yards per carry) against Baltimore’s second-ranked run defense. His patient running style and fourth-quarter dominance proved decisive.
Film Study Numbers:
- Yards Before Contact: 29 (1.3 per carry)
- Yards After Contact: 78 (3.4 per carry)
- Broken Tackles: 4
- Yards Per Carry After Broken Tackle: 5.8
Barkley’s workload distribution tells the story. Philadelphia gave him three carries in the first quarter and six in the second quarter while establishing the passing game. Then they unleashed him in the fourth quarter with 14 carries for 64 yards when Baltimore’s defense showed fatigue.
His 25-yard touchdown run at 7:56 in the fourth quarter broke the game open. He touched the ball on every snap during that seven-play, 71-yard scoring drive, wearing down a Ravens defense that had been on the field for extended stretches.
The offensive line deserves equal credit. Pro Football Focus named Philadelphia’s offensive line Team of the Week. Left tackle Jordan Mailata earned Offensive Player of the Week honors with a 94.5 overall grade (95.6 run-blocking grade). The unit allowed zero sacks and surrendered just three total pressures all afternoon.
All five starters played every offensive snap (56/56, 100%): Jordan Mailata, Landon Dickerson, Cam Jurgens, Mekhi Becton, and Lane Johnson. Their cohesion and dominance up front created rushing lanes and gave Hurts clean pockets. Mailata allowed one pressure on 24 pass-blocking snaps, neutralizing Baltimore’s edge rushers throughout.
Lamar Jackson: All the Yards, None of the Results
Jackson produced video game numbers that somehow resulted in a loss.
| Stat | Total |
|---|---|
| Completions/Attempts | 23/36 (63.9%) |
| Passing Yards | 237 |
| Passing Touchdowns | 2 |
| Interceptions | 0 |
| Passer Rating | 101.3 |
| Sacks Taken | 3 (31 yards lost) |
| Rush Attempts | 8 |
| Rush Yards | 79 |
| Rush Touchdowns | 0 |
Advanced Metrics:
- Intended Air Yards: 362
- Average Depth of Target: 10.1 yards
- Completed Air Yards: 138 (58.2% of passing total)
- Yards After Catch: 99 (41.8% of passing total)
- Bad Throws: 5
- Receiver Drops: 4
- Pressures Faced: 20 (3 sacks, 2 QB hits, 14 hurries)
Jackson accounted for 316 of Baltimore’s 372 total yards (84.9%). His dual-threat excellence kept the Ravens competitive throughout. Yet three sacks for 31 yards lost changed everything.
A 14-yard sack on third-and-five in the third quarter was catastrophic. The loss of yardage pushed what would have been a makeable 33-yard field goal into a 47-yard attempt that Tucker missed wide left. A 12-yard sack by Jalen Carter in the second quarter killed a promising drive inside Philadelphia territory.
Philadelphia’s pass rush generated constant pressure without blitzing. Twenty total pressures (3 sacks, 2 QB hits, 14 hurries) forced Jackson into hurried throws and disrupted timing routes. His four dropped passes didn’t help, but the damage from lost yardage on sacks proved insurmountable.
Baltimore’s Passing Attack
| Player | Targets | Catches | Yards | Avg | Long | TD | Rating |
|---|---|---|---|---|---|---|---|
| Mark Andrews | 7 | 6 | 67 | 11.2 | 23 | 1 | 146.1 |
| Zay Flowers | 7 | 3 | 74 | 24.7 | 40 | 0 | 81.8 |
| Isaiah Likely | 8 | 5 | 38 | 7.6 | 11 | 1 | 113.5 |
| Justice Hill | 6 | 4 | 15 | 3.8 | 5 | 0 | 70.1 |
| Derrick Henry | 3 | 3 | 29 | 9.7 | 16 | 0 | 106.9 |
| Tylan Wallace | 2 | 2 | 14 | 7.0 | 12 | 0 | 95.8 |
Andrews’ first-quarter touchdown had just an 18.1% completion probability according to NFL Next Gen Stats, making it the 14th-least likely touchdown catch of the entire 2024 season. The contested grab over multiple defenders showcased elite talent but also reflected an offense forced into difficult throws rather than executing easy completions.
His six catches for 67 yards tied Jamal Lewis for the Ravens franchise record with his 47th career touchdown. Andrews’ 10.3-yard average depth of target showed Baltimore’s willingness to attack downfield, but Philadelphia’s secondary adjusted after early success.
Flowers hauled in a 40-yard pass on Baltimore’s opening drive, instantly giving the Ravens momentum. Then Philadelphia locked him down. His final two catches gained just 34 yards as the secondary focused on eliminating the deep ball. His 20.3-yard average depth of target was team-high, but he converted just three of seven targets.
Ground Game Struggles
Baltimore accumulated 166 rushing yards but couldn’t punch it in on the ground.
| Player | Carries | Yards | Avg | Long | TD | YBC | YBC/Att | YAC | YAC/Att | Broken Tackles |
|---|---|---|---|---|---|---|---|---|---|---|
| Derrick Henry | 19 | 82 | 4.3 | 19 | 0 | 23 | 1.2 | 59 | 3.1 | 6 |
| Lamar Jackson | 8 | 79 | 9.9 | 39 | 0 | 47 | 5.9 | 32 | 4.0 | 0 |
| Justice Hill | 3 | 6 | 2.0 | 3 | 0 | 0 | 0.0 | 6 | 2.0 | 1 |
| Mark Andrews | 1 | 2 | 2.0 | 2 | 0 | 0 | 0.0 | 2 | 2.0 | 0 |
| Zay Flowers | 1 | -3 | -3.0 | -3 | 0 | -3 | -3.0 | 0 | 0.0 | 0 |
Henry averaged just 1.2 yards before contact, exposing how quickly Philadelphia’s defensive front penetrated Baltimore’s blocking schemes. He broke six tackles and generated 59 yards after contact, showcasing trademark power, but the Eagles controlled the line of scrimmage.
His respectable 4.3 yards per carry masked the reality: Philadelphia stifled him when games hung in balance. Key stops on third-and-short situations prevented Baltimore from sustaining drives and maintaining offensive rhythm.
Philadelphia’s Defense Strangles Baltimore in Critical Moments
The Eagles allowed 372 yards but made stops when necessary, particularly in the red zone and third quarter.
Tackle Leaders
| Player | Position | Total | Solo | Assists | Sacks | TFL | QB Hits | PD |
|---|---|---|---|---|---|---|---|---|
| Zack Baun | LB | 13 | 8 | 5 | 0.5 | 1 | 1 | 0 |
| Nakobe Dean | LB | 10 | 5 | 5 | 0.0 | 0 | 0 | 0 |
| Nolan Smith Jr. | LB | 8 | 3 | 5 | 1.0 | 1 | 1 | 0 |
| Cooper DeJean | CB | 5 | 5 | 0 | 0.0 | 0 | 0 | 1 |
| Josh Sweat | OLB | 5 | 3 | 2 | 0.0 | 0 | 0 | 0 |
Baun never left the field (72/72 snaps, 100%). His most crucial play came in the third quarter when he dropped Derrick Henry for a four-yard loss on third-and-two, forcing a punt and preserving Philadelphia’s lead. His 0.5 sack split with Jalyx Hunt on third-and-five pushed Baltimore out of field goal range.
Philadelphia’s defensive personnel remained remarkably consistent. Baun, Isaiah Rodgers, and C.J. Gardner-Johnson all played every defensive snap (100%). Jalen Carter missed just one snap (71/72, 99%). Quinyon Mitchell logged 70 snaps (97%). Nakobe Dean played 69 snaps (96%). This continuity allowed complex coverage disguises and eliminated communication breakdowns.
Pass Rush Dominance
| Player | Sacks | QB Hits | Total Pressures | TFL |
|---|---|---|---|---|
| Jalen Carter | 1.0 | 2 | 3 | 3 |
| Nolan Smith Jr. | 1.0 | 1 | 2 | 1 |
| Jalyx Hunt | 0.5 | 1 | 1 | 0 |
| Zack Baun | 0.5 | 1 | 1 | 1 |
Total Defensive Pressure: 20 (3 sacks, 6 QB hits, 14 hurries)
Carter was unstoppable from the defensive tackle position. Four tackles, one sack, three tackles for loss, and constant interior disruption on 71 snaps. His 12-yard sack of Jackson in the second quarter killed a Ravens drive inside Philadelphia territory. Carter’s penetration forced Baltimore’s guards into constant recovery mode, disrupting blocking schemes and creating opportunities for edge rushers.
The three sacks for 31 yards represented drive-killing moments. Each came on critical downs, either ending possessions or forcing Baltimore into unfavorable third-and-long situations they couldn’t convert.
Baltimore’s Defense Contained But Couldn’t Break
The Ravens defense held Philadelphia to 252 yards and forced multiple three-and-outs but couldn’t generate the turnover needed to shift momentum.
Ravens Tackle Leaders
| Player | Position | Total | Solo | Assists | Sacks | TFL | QB Hits |
|---|---|---|---|---|---|---|---|
| Roquan Smith | LB | 11 | 2 | 9 | 0.5 | 0 | 1 |
| Ar’Darius Washington | S | 8 | 6 | 2 | 0.0 | 2 | 0 |
| Chris Board | LB | 7 | 5 | 2 | 0.0 | 1 | 0 |
| Brandon Stephens | CB | 4 | 4 | 0 | 0.0 | 0 | 0 |
| Kyle Hamilton | S | 4 | 3 | 1 | 0.0 | 0 | 0 |
Smith never left the field (56/56 snaps, 100%), finishing with 11 tackles and a half-sack. Washington and Hamilton also played every defensive snap. Marlon Humphrey logged 55 of 56 snaps (98%) at cornerback, shadowing receivers throughout.
Broderick Washington Jr. played 32 snaps (57%) in rotation, recording one sack and forcing a Saquon Barkley fumble that Barkley recovered.
Total Defensive Pressure on Hurts: 19 (1 sack, 1 QB hit, 15 hurries)
Baltimore generated consistent pressure but couldn’t finish. Hurts’ quick release and Philadelphia’s offensive line protection neutralized the pass rush when it mattered most. The defense held Philadelphia to just 252 yards but couldn’t create the game-changing turnover to give the offense a short field.
Justin Tucker’s Historic Collapse
Tucker’s three missed kicks decided the outcome in a five-point game.
| Kicker | Team | FG Made/Att | FG % | Long | XP Made/Att | XP % | Total Points |
|---|---|---|---|---|---|---|---|
| Jake Elliott | PHI | 1/1 | 100% | 35 | 3/3 | 100% | 6 |
| Justin Tucker | BAL | 2/4 | 50% | 50 | 1/2 | 50% | 7 |
Tucker’s Misses:
- Q1, 3:49: Extra point after Andrews TD (hit left upright)
- Q3, 10:00: 47-yard field goal (wide left)
- Q3, 1:26: 53-yard field goal (wide right)
Tucker’s Makes:
- Q1, 9:21: 34-yard field goal
- Q2, 0:03: 50-yard field goal
Seven points left on the field in a five-point loss. Tucker’s first career game with three missed kicks came at the worst possible moment. A future Hall of Famer known for clutch performance couldn’t deliver when Baltimore needed him most.
Elliott converted all four attempts (1/1 FG, 3/3 XP), providing flawless execution that contrasted sharply with Tucker’s struggles. His 35-yard field goal with 1:03 remaining extended Philadelphia’s lead to 24-12, forcing Baltimore to need two scores instead of one.
Field Position Battle
Mann consistently pinned Baltimore deep while Stout couldn’t match his precision.
| Punter | Team | Punts | Yards | Average | Long | Inside 20 | Touchbacks | Net Avg |
|---|---|---|---|---|---|---|---|---|
| Braden Mann | PHI | 6 | 307 | 51.2 | 58 | 5 | 0 | 48.5 |
| Jordan Stout | BAL | 4 | 191 | 47.8 | 58 | 0 | 0 | 40.5 |
Mann dropped five of six punts inside the Baltimore 20-yard line. His most important punt came in the second quarter when he pinned the Ravens at their one-yard line, forcing a three-and-out that gave Philadelphia’s offense the ball back at midfield. That field position swing led directly to a touchdown.
His 48.5-yard net average crushed Stout’s 40.5-yard mark, consistently giving Philadelphia advantages in field position that compounded throughout the game.
Red Zone Execution Decided Everything
Statistics don’t lie about what separated these teams inside the 20-yard line.
| Team | Red Zone Attempts | Touchdowns | Field Goals | Missed Kicks | TD % |
|---|---|---|---|---|---|
| Philadelphia | 3 | 2 | 1 | 0 | 66.7% |
| Baltimore | 5 | 2 | 0 | 2 | 40.0% |
Philadelphia scored touchdowns on two of three red zone trips. Baltimore converted just two of five attempts. Both Ravens touchdowns came in the first and fourth quarters (9-0 lead, then garbage-time score with 3 seconds left). Tucker’s two missed field goals from the red zone (after sacks pushed Baltimore back to 47 and 53 yards) exposed Baltimore’s inability to finish drives.
Philadelphia’s defense transformed inside the 20. They bent throughout the game, allowing Baltimore to move the ball, but refused to break when protecting the end zone. This bend-don’t-break philosophy forced Tucker into field goal attempts he couldn’t convert.
The 26.7% gap in red zone touchdown efficiency correlates directly to the five-point margin. This same pattern has decided other marquee matchups this season, including when Buffalo rallied from 10-0 down against Tennessee by converting red zone opportunities in the second half while the Titans couldn’t capitalize on early drives.
Quarter-by-Quarter Game Flow
First Quarter: Baltimore Takes Control
Baltimore jumped ahead 9-0 on Tucker’s 34-yard field goal (9:21) and Andrews’ 14-yard touchdown (3:49). Tucker’s missed extra point after Andrews’ score was an early warning. Philadelphia’s offense struggled, gaining just six net yards on three possessions. The Ravens controlled tempo and appeared headed for a comfortable home victory.
Second Quarter: Philadelphia’s Response
Everything changed in 15 minutes. Hurts found Goedert for a 17-yard touchdown at 8:04, cutting the deficit to 9-7. Two minutes later, Hurts powered in from one yard out to give Philadelphia their first lead at 14-9. Tucker’s 50-yard field goal with three seconds left before halftime made it 14-12, keeping Baltimore within striking distance.
Halftime Score: Philadelphia 14, Baltimore 12
Third Quarter: The Scoreless Stretch
Baltimore dominated possession for 12 of 15 minutes without scoring a single point. Tucker missed field goals from 47 yards (10:00) and 53 yards (1:26). The Ravens moved the ball effectively between the 20-yard lines but couldn’t finish drives when sacks pushed them out of comfortable field goal range. Philadelphia’s defense survived the extended time on the field without allowing points, maintaining their two-point advantage.
Fourth Quarter: Barkley Seals Victory
Barkley broke free for a 25-yard touchdown at 7:56, extending Philadelphia’s lead to 21-12. Elliott’s 35-yard field goal at 1:03 made it 24-12, essentially ending the game. Likely’s 11-yard touchdown with three seconds remaining provided the final margin but came far too late to affect the outcome.
Playoff Picture and Standings Impact
Philadelphia improved to 10-2, the best record in the NFC at that point. The Eagles extended their NFC East lead to 2.5 games over Washington (7-5), controlling their playoff destiny with four games remaining. Their schedule included home games against Carolina (Week 14) and Pittsburgh (Week 15) before a critical Week 16 road trip to Washington that could clinch the division.
Baltimore dropped to 8-5, falling 1.5 games behind Pittsburgh (9-3) in the AFC North after the Steelers defeated Cincinnati 44-38 in Week 13’s other marquee matchup. The Ravens entered their Week 14 bye needing to regroup before a brutal December stretch:
- Week 15: @ New York Giants (December 15)
- Week 16: vs Pittsburgh Steelers (December 21) – Division showdown with playoff seeding implications
- Week 17: @ Houston Texans (December 25) – Christmas Day showcase
That Pittsburgh game carried massive significance. A Ravens victory would pull them within half a game with two weeks remaining. A loss would drop them three games back with just one game left, essentially ending their division title hopes.
According to Pro Football Reference’s game logs, Jackson’s record against NFC opponents fell to 23-2 as a starter, one of the most dominant inter-conference records in recent NFL history. Despite that success, he couldn’t overcome the special teams meltdown and defensive lapses when protecting a late lead.
Philadelphia also covered the 3-point spread as underdogs. The game went under the 51-point total with 43 combined points, rewarding bettors who took the under.
Frequently Asked Questions
How many rushing yards did Saquon Barkley have vs Ravens December 2024?
Barkley rushed for 107 yards on 23 carries (4.7 yards per carry) with one touchdown against Baltimore on December 1, 2024. His 25-yard fourth-quarter touchdown run at 7:56 extended Philadelphia’s lead to 21-12 and proved decisive.
What was Lamar Jackson’s passing stats Eagles vs Ravens December 1, 2024?
Jackson completed 23 of 36 passes (63.9%) for 237 yards and two touchdowns with zero interceptions (101.3 passer rating). He added 79 rushing yards on eight carries. Despite his production, Jackson was sacked three times for 31 yards lost at critical moments.
How many field goals did Justin Tucker miss vs Philadelphia?
Tucker missed two field goals (47 and 53 yards) and one extra point against Philadelphia. He made field goals from 34 and 50 yards plus one extra point, but his three misses left seven points on the field in a five-point loss. This marked the first game in his career with three missed kicks.
What were Jalen Hurts stats against Baltimore Ravens?
Hurts completed 11 of 19 passes (57.9%) for 118 yards and one touchdown with zero interceptions (93.8 rating). He rushed nine times for 29 yards and one touchdown, scoring on a 1-yard run in the second quarter.
Why did Baltimore Ravens lose to Philadelphia Eagles despite more yards?
Baltimore outgained Philadelphia 372-252 but lost due to three factors: red zone inefficiency (40% TD rate vs Philadelphia’s 66.7%), Justin Tucker missing three kicks (2 FGs + 1 XP = 7 points), and three sacks for 31 yards lost at critical moments that pushed field goals out of range.
What was the red zone efficiency difference Eagles vs Ravens?
Philadelphia scored touchdowns on 2 of 3 red zone trips (66.7%). Baltimore converted just 2 of 5 attempts (40.0%). That 26.7% gap in red zone touchdown efficiency correlated directly to the five-point margin.
Who were the leading receivers in Eagles Ravens game December 2024?
For Philadelphia: A.J. Brown led with 5 catches for 66 yards, followed by Dallas Goedert (3 catches, 35 yards, 1 TD). For Baltimore: Zay Flowers had 3 catches for 74 yards, while Mark Andrews caught 6 passes for 67 yards and 1 touchdown.
Final Game Information Summary
Date: Sunday, December 1, 2024
Location: M&T Bank Stadium, Baltimore, Maryland
Attendance: 71,344
Duration: 3:05
Weather: 41°F, outdoors, 41% humidity, wind 7 mph
Surface: Natural grass
Betting: Baltimore -3.0 | O/U 51.0 (Philadelphia covered, Under hit)
Officials:
- Referee: Craig Wrolstad (#4)
- Umpire: Steven Woods (#54)
- Down Judge: Danny Short (#113)
- Line Judge: Brett Bergman (#17)
- Field Judge: Jeff Shears (#60)
- Side Judge: Frank Steratore (#132)
- Back Judge: Rich Martinez (#39)
- Replay Official: Gavin Anderson (#0)
Coin Toss: Baltimore won and deferred; Philadelphia received opening kickoff
This complete breakdown of Eagles vs Ravens match player stats from December 1, 2024, demonstrates how red zone execution, special teams precision, and timely defensive stops matter more than total yardage in close games between playoff contenders.