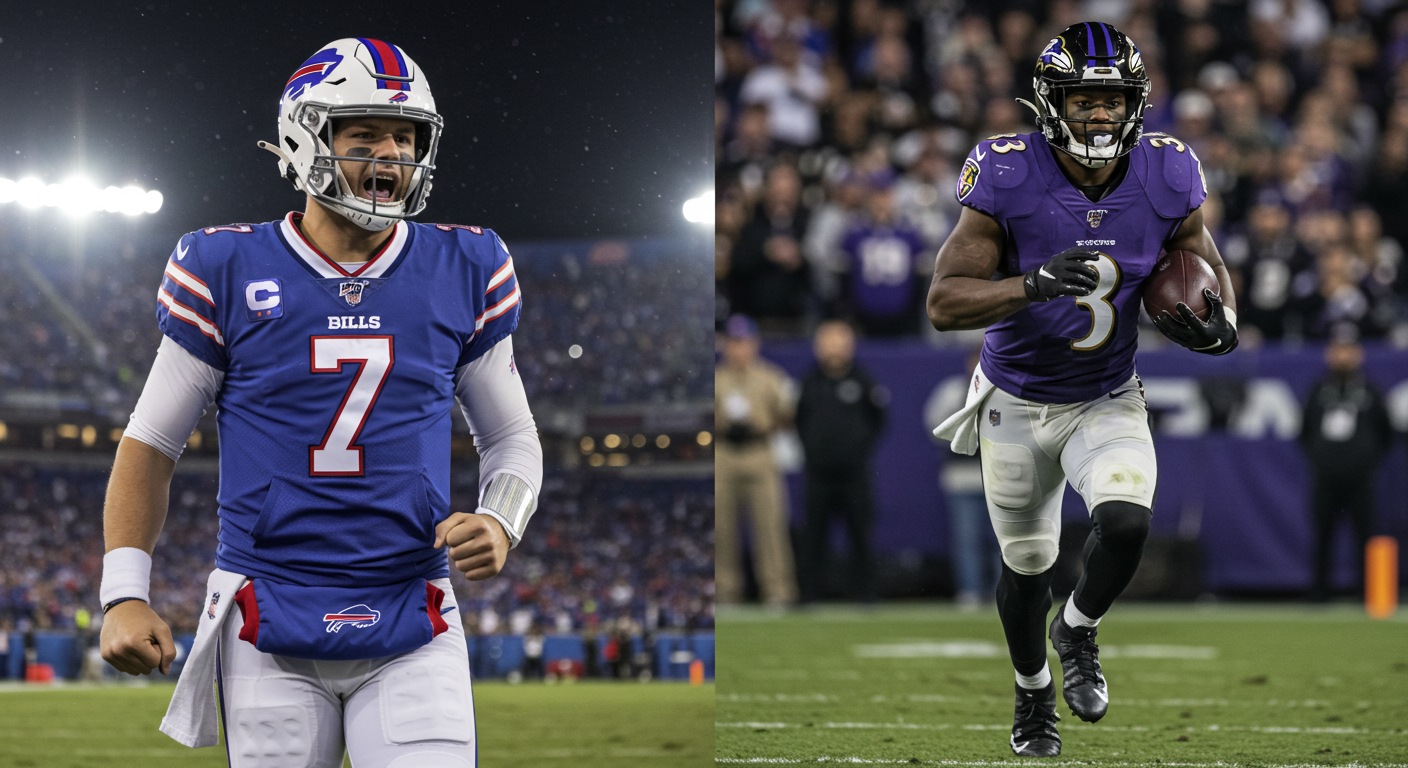
Baltimore Ravens vs Buffalo Bills Match Player Stats (Sep 7, 2025)
Baltimore led by 15 with three minutes left. In NFL history, 717 teams had faced that situation since 2017. All 717 lost.
Until September 7, 2025.
Game Summary
| Final Score | Buffalo 41, Baltimore 40 |
| Date | September 7, 2025 |
| Location | Highmark Stadium, Orchard Park, NY |
| Attendance | 70,745 |
| Key Player | Josh Allen: 394 pass yards, 4 total TDs |
| Turning Point | Ed Oliver forced fumble with 3:06 remaining |
| Historic First | Only team to win trailing by 15+ with 4 minutes left |
| Win Probability | Bills at 1.1% with 8:37 remaining (Next Gen Stats) |
Buffalo rallied from a 40-25 deficit in the final 3:06 to win 41-40. The Bills scored 16 points in the final four minutes. Baltimore became the first team in NFL history to score 40+ points and rush for 235+ yards in a loss. Teams were previously 277-0 in games with those numbers.
This was Highmark Stadium’s final home opener. The Bills move into a new $2.1 billion facility in 2026.
Table of Contents
Score By Quarter
| Quarter | Ravens | Bills |
|---|---|---|
| 1st | 3 | 7 |
| 2nd | 17 | 6 |
| 3rd | 14 | 6 |
| 4th | 6 | 22 |
| Final | 40 | 41 |
Baltimore dominated three quarters. Buffalo owned the fourth, outscoring the Ravens 22-6 in the final period.
Josh Allen Stats
Allen accounted for 85% of Buffalo’s offensive production. His 251 passing yards in the fourth quarter alone exceeded what 24 of 32 Week 1 starting quarterbacks managed in entire games. He completed 12 explosive passes (15+ yards) for 287 yards, including 5 deep completions (20+ yards) for 130 yards.
Allen’s adjusted completion percentage was 81.8%. He averaged 9.5 yards per target with an aDOT of 9.5 yards. His receivers generated 178 yards after catch on 34 completions (5.2 YAC per completion). He averaged 2.97 seconds per throw while facing 18 total pressures from Baltimore’s defense.
| Completions/Attempts | 33/46 |
| Passing Yards | 394 |
| Passing Touchdowns | 2 |
| Interceptions | 0 |
| Passer Rating | 112.0 |
| Rush Attempts | 14 |
| Rushing Yards | 30 |
| Rushing Touchdowns | 2 |
| Total Yards | 424 |
| Total Touchdowns | 4 |
| Sacks Taken | 1 |
This marked Allen’s seventh career game with at least two passing touchdowns and two rushing touchdowns. That extends his own NFL record. The second and third place players on that list (Steve Young with four, Cam Newton with three) have seven such games combined. Allen’s PFF grade of 87.0 ranked second among all players in this game behind only Ed Oliver’s 92.3.
Allen earned his 77th career win, tying Joe Ferguson for second in Bills franchise history. He completed 33 of 46 passes without turning the ball over once.
Lamar Jackson Stats
Jackson finished 14 of 19 for 209 yards and two touchdowns. His 144.4 passer rating topped all Week 1 quarterbacks. He added 70 yards and another score on six carries. His adjusted completion percentage of 83.3% accounted for drops and throwaways.
Jackson averaged 9.6 yards per target with an average depth of target (aDOT) of 9.6 yards. His receivers generated 112 yards after catch on his 14 completions (8.0 YAC per completion). Baltimore completed 6 explosive passes (15+ yards) for 162 yards, including 2 deep completions (20+ yards) for 49 yards.
| Completions/Attempts | 14/19 |
| Passing Yards | 209 |
| Passing Touchdowns | 2 |
| Interceptions | 0 |
| Passer Rating | 144.4 |
| Rush Attempts | 6 |
| Rushing Yards | 70 |
| Yards Per Carry | 11.7 |
| Rushing Touchdowns | 1 |
| Long Rush | 19 |
| Sacks | 2 |
| Total Yards | 279 |
| Total Touchdowns | 3 |
Jackson completed 73.7% of his passes. His 11.7 yards per carry on six rushes included his 10-yard touchdown scramble in the second quarter and a 19-yard burst that set up another score. Baltimore scored on seven of their first eight possessions with Jackson orchestrating the attack. He averaged 3.02 seconds per throw, managing the pocket efficiently despite facing 9 total pressures.
Head-to-Head QB Comparison
| Stat | Lamar Jackson | Josh Allen |
|---|---|---|
| Comp/Att | 14/19 | 33/46 |
| Completion % | 73.7% | 71.7% |
| Passing Yards | 209 | 394 |
| Pass TD | 2 | 2 |
| Interceptions | 0 | 0 |
| Passer Rating | 144.4 | 112.0 |
| Rush Attempts | 6 | 14 |
| Rushing Yards | 70 | 30 |
| Yards Per Carry | 11.7 | 2.1 |
| Rush TD | 1 | 2 |
| Long Rush | 19 | 9 |
| Sacks | 2 | 1 |
| Total Yards | 279 | 424 |
| Total TD | 3 | 4 |
Jackson was more efficient. Allen created more volume. Baltimore ran 50 offensive plays. Buffalo ran 78. When Baltimore’s 50-play perfection cracked on a single fumble, Buffalo’s 78-play persistence took over.
Derrick Henry Performance
Henry rushed for 169 yards and two touchdowns on 18 carries. He averaged 9.4 yards per attempt. His runs of 30, 46, and 49 yards showcased the explosiveness that made him a two-time rushing champion.
| Rush Attempts | 18 |
| Rushing Yards | 175 (PFF) |
| Yards Per Carry | 9.7 |
| Yards Before Contact | 3.1 |
| Yards After Contact | 5.4 |
| Rushing Touchdowns | 2 |
| Long Rush | 49 |
| Receptions | 1 |
| Receiving Yards | 13 |
| Total Yards | 188 |
| Fumbles | 1 |
| Fumbles Lost | 1 |
| Missed Tackles Forced | 2 |
His 46-yard touchdown with 11:42 left put Baltimore ahead 40-25. That score gave him 108 career rushing touchdowns, passing Jim Brown for sixth place all-time. It was also his 13th game with at least 150 rushing yards and two touchdowns, tying Brown’s record.
At 3:06, Ed Oliver forced Henry’s fumble. Terrel Bernard recovered at Baltimore’s 30. Henry addressed his mistake afterward: “I told my teammates after the game, put the loss on me. I own it like a man. Got lackadaisical and they made a play. If I take care of the ball, I feel like it would be a different situation.”
Complete Team Statistics
| Category | Ravens | Bills |
|---|---|---|
| Total Plays | 50 | 78 |
| Total Yards | 440 (PFF) | 497 |
| Yards Per Play | 8.8 | 6.4 |
| EPA Per Play | 0.297 | 0.077 |
| First Downs | 19 | 29 |
| Possessions | 11 | 12 |
| Plays Per Drive | 5.7 | 7.2 |
| Yards Per Drive | 36.7 | 38.2 |
| Points Per Drive | 3.3 | 3.1 |
| Rushing Attempts | 29 | 30 |
| Rushing Yards | 245 (PFF) | 91 |
| Yards Per Rush | 8.4 | 3.0 |
| Yards Before Contact | 3.1 | 0.6 |
| Yards After Contact | 5.4 | 2.1 |
| Explosive Runs (10+) | 10 | 1 |
| Explosive Passes (15+) | 6 | 12 |
| 3rd Down Conv | 6/11 (54.5%) | 7/15 (46.7%) |
| 4th Down Conv | 0/0 | 1/1 (100%) |
| Red Zone Conv | 1/3 (33.3%) | 5/7 (71.4%) |
| Penalties | 7-51 | 5-38 |
| Turnovers | 1 | 0 |
| Time of Possession | 25:11 | 34:49 |
Baltimore’s 8.6 yards per play and 8.2 yards per carry represented elite offensive efficiency. They scored on seven of eight possessions through three quarters. But they only ran 50 total plays.
Buffalo controlled possession for nearly 35 minutes and ran 28 more plays. The red zone disparity was decisive: Baltimore converted one of three trips (33%), Buffalo converted five of seven (71%).
Ravens Receiving Leaders
| Player | Receptions | Yards | Avg | TD | Long | Targets |
|---|---|---|---|---|---|---|
| Zay Flowers | 7 | 143 | 20.4 | 1 | 39 | 9 |
| DeAndre Hopkins | 2 | 35 | 17.5 | 1 | 29 | 2 |
| Derrick Henry | 1 | 13 | 13.0 | 0 | 13 | 1 |
| Rashod Bateman | 2 | 10 | 5.0 | 0 | 5 | 4 |
| Mark Andrews | 1 | 5 | 5.0 | 0 | 5 | 1 |
| Justice Hill | 1 | 3 | 3.0 | 0 | 3 | 2 |
Flowers posted a career-high 143 yards, leading all NFL receivers in Week 1. Jackson targeted him nine times, completing seven. His 39-yard catch in the third quarter set up his 23-yard touchdown reception.
Hopkins caught both targets for 35 yards and a score. His 29-yard touchdown catch late in the third quarter put Baltimore ahead 34-19. A fan struck Hopkins after the play, prompting Jackson to shove the fan back. The fan was ejected.
Bills Receiving Leaders
| Player | Receptions | Yards | Avg | TD | Long | Targets |
|---|---|---|---|---|---|---|
| Keon Coleman | 8 | 112 | 14.0 | 1 | 25 | 11 |
| Khalil Shakir | 6 | 64 | 10.7 | 0 | 26 | 9 |
| Joshua Palmer | 5 | 61 | 12.2 | 0 | 32 | 9 |
| James Cook | 5 | 58 | 11.6 | 0 | 51 | 5 |
| Dalton Kincaid | 4 | 48 | 12.0 | 1 | 22 | 4 |
| Dawson Knox | 2 | 20 | 10.0 | 0 | 12 | 2 |
| Jackson Hawes | 1 | 29 | 29.0 | 0 | 29 | 1 |
| Elijah Moore | 1 | 3 | 3.0 | 0 | 3 | 1 |
Coleman’s debut featured eight catches for 112 yards and the go-ahead touchdown. Allen targeted the rookie 11 times, trusting him in critical situations. His 25-yard catch on the final drive moved Buffalo into field goal range with seconds remaining.
Kincaid caught Allen’s opening touchdown pass, a 15-yard strike that gave Buffalo an early 7-0 lead. Cook contributed 58 receiving yards to go with his 44 rushing yards and touchdown.
Defensive Statistics
Buffalo Bills Defense
| Player | Position | Tackles | Solo | Sacks | TFL | FF | FR |
|---|---|---|---|---|---|---|---|
| Christian Benford | CB | 7 | 5 | 0 | 0 | 0 | 0 |
| Ed Oliver | DT | 6 | 6 | 1 | 3 | 1 | 0 |
| Taylor Rapp | S | 6 | 4 | 0 | 0 | 0 | 0 |
| Matt Milano | LB | 4 | 4 | 1 | 0 | 0 | 0 |
| Terrel Bernard | LB | 3 | 2 | 0 | 1 | 0 | 1 |
Oliver posted six tackles, three tackles for loss, one sack, and the forced fumble that changed the game. Milano added another sack. Buffalo sacked Jackson twice total.
The Bills’ defense couldn’t stop Baltimore for 57 minutes. Then they got one crucial stop when it mattered most. After Allen’s second rushing touchdown cut the lead to 40-38, Buffalo’s defense forced a three-and-out, giving Allen one final possession.
Baltimore Ravens Defense
| Player | Position | Tackles | Solo | Sacks | TFL | PD |
|---|---|---|---|---|---|---|
| Roquan Smith | LB | 10 | 8 | 0 | 0 | 0 |
| Kyle Hamilton | S | 9 | 6 | 0 | 0 | 2 |
| Malaki Starks | S | 7 | 3 | 0 | 0 | 0 |
| Nnamdi Madubuike | DT | 6 | 4 | 1 | 1 | 0 |
| Chidobe Awuzie | CB | 6 | 2 | 0 | 0 | 0 |
| Nate Wiggins | CB | 5 | 5 | 0 | 0 | 0 |
Smith led all defenders with 10 tackles. Hamilton recorded nine stops and two pass deflections. Madubuike had Baltimore’s only sack. The defense couldn’t force a single turnover or get a crucial fourth-quarter stop.
Special Teams Comparison
Buffalo Bills – Matt Prater
- Field Goals: 3/3 (100%)
- Long: 43 yards
- Extra Points: 2/2
- Total Points: 11
Baltimore Ravens – Tyler Loop
- Field Goals: 2/2 (100%)
- Long: 52 yards
- Extra Points: 4/5 (80%)
- Total Points: 10
Loop was a sixth-round rookie making his NFL debut. Baltimore released Justin Tucker in the offseason after Tucker was accused of inappropriate sexual behavior by massage therapists. Loop replaced a legend.
He converted field goals of 52 and 49 yards. His missed extra point after Henry’s fourth-quarter touchdown altered the game’s mathematics. Buffalo needed a field goal to win instead of a touchdown to tie.
Prater joined Buffalo’s practice squad Thursday, September 4. He was elevated Saturday, September 6. He played Sunday, September 7. He converted all three field goal attempts, including the 32-yarder with three seconds left according to CBS Sports.
Scoring Timeline
| Time | Quarter | Play | Score |
|---|---|---|---|
| 11:19 | 1st | Allen 15-yard TD pass to Kincaid | BUF 7, BAL 0 |
| 3:38 | 1st | Loop 52-yard field goal | BUF 7, BAL 3 |
| 13:35 | 2nd | Henry 30-yard TD run | BUF 7, BAL 10 |
| 9:47 | 2nd | Jackson 10-yard TD run | BUF 7, BAL 17 |
| 2:50 | 2nd | Prater 25-yard field goal | BUF 10, BAL 17 |
| 0:31 | 2nd | Loop 49-yard field goal | BUF 10, BAL 20 |
| 0:00 | 2nd | Prater 43-yard field goal | BUF 13, BAL 20 |
| 12:48 | 3rd | Jackson 23-yard TD pass to Flowers | BUF 13, BAL 27 |
| 7:47 | 3rd | Cook 2-yard TD run (2PT failed) | BUF 19, BAL 27 |
| 1:09 | 3rd | Jackson 29-yard TD pass to Hopkins | BUF 19, BAL 34 |
| 12:51 | 4th | Allen 2-yard TD run (2PT failed) | BUF 25, BAL 34 |
| 11:42 | 4th | Henry 46-yard TD run (PAT missed) | BUF 25, BAL 40 |
| 3:56 | 4th | Allen 10-yard TD pass to Coleman | BUF 32, BAL 40 |
| 1:58 | 4th | Allen 1-yard TD run (2PT failed) | BUF 38, BAL 40 |
| 0:00 | 4th | Prater 32-yard field goal | BUF 41, BAL 40 |
Fourth Quarter Breakdown
12:51 Remaining Allen scored on a 2-yard run. Buffalo trailed 34-25. The two-point conversion failed.
11:42 Remaining Henry broke free for a 46-yard touchdown. Baltimore led 40-25. Loop’s missed extra point kept the deficit at 15 instead of 16.
3:06 Remaining Oliver forced Henry’s fumble. Bernard recovered at Baltimore’s 30.
3:56 Remaining Four plays later, Allen hit Coleman for a 10-yard touchdown. Buffalo trailed 40-32. Prater made the extra point.
1:58 Remaining Buffalo’s defense forced a three-and-out. Baltimore punted.
1:33 Remaining Allen took over at his own 20. He completed passes of 6, 8, 5, 32, and 25 yards. The 32-yarder went to Palmer. The 25-yarder went to Coleman. Buffalo reached Baltimore’s 14.
0:03 Remaining Allen spiked the ball to stop the clock.
0:00 Remaining Prater’s 32-yard field goal sailed through as time expired.
Historic Records Set
Buffalo Bills
- First team in NFL history to win when trailing by 15+ points with 4 minutes remaining
- Extended home winning streak to 12 straight regular season games
- Josh Allen’s 77th career win (tied Joe Ferguson for second in franchise history)
- Allen’s 7th game with 2+ passing and 2+ rushing TDs (NFL record, ahead of Steve Young’s 4 and Cam Newton’s 3)
Baltimore Ravens
- First team in NFL history to score 40+ points AND rush for 235+ yards in a loss
- Teams were 277-0 (including playoffs) with those numbers before this game
- John Harbaugh’s 8th loss when leading by 8+ points in the fourth quarter (most since 2000)
Individual Milestones
- Derrick Henry: 108 career rushing TDs (6th all-time, passed Jim Brown)
- Henry: 13th game with 150+ rush yards and 2 TDs (tied Jim Brown’s record)
- First 41-40 final score in NFL history (1,092nd unique score ever)
Complete game statistics are available at Pro Football Reference and Fox Sports.
Season Impact
This victory extended Buffalo’s home dominance. The Bills have won 12 straight regular season games at Highmark Stadium, second-longest in franchise history. Their last home loss came November 13, 2023, when Denver kicked a walk-off field goal after a too-many-men penalty gave them a second chance. Buffalo went 8-0 at home in 2024.
This was Buffalo’s 53rd and final home opener at Highmark Stadium. The facility opened in 1973. Buffalo moves into a new stadium across the street in 2026.
For Buffalo, this win validated their championship potential seven months after their 32-29 AFC Championship loss to Kansas City on January 26, 2025. The mental toughness required to rally from 15 down proved they could handle pressure situations against elite opponents.
For Baltimore, this loss triggered a month-long slide. The Ravens started 1-3, their worst four-game stretch since 2015. Harbaugh’s inability to close fourth-quarter leads became a pattern. Eight times since taking over in 2008, his teams have blown leads of 8+ points in the fourth quarter. No other coach since 2000 has lost more than six such games.
Fan Incident Details
Late in the third quarter, a fan struck DeAndre Hopkins after his 29-yard touchdown catch. Jackson shoved the fan back into his seat. Security ejected the fan.
Jackson addressed the incident: “I seen him slap D-Hop, then he slapped me, and he was talking and I just forgot where I was for a little bit. I just let my emotions get the best of me there. I’ll handle it better next time.”
Key Statistical Factors
Turnover Differential: Buffalo +1 (Baltimore 1, Buffalo 0)
Red Zone Efficiency: Buffalo 71.4% (5/7), Baltimore 33.3% (1/3)
Fourth Quarter Points: Buffalo 22, Baltimore 6
Time of Possession: Buffalo 34:49, Baltimore 25:11
Plays Run: Buffalo 78, Baltimore 50
Final Margin: 1 point
One fumble. One missed extra point. One clutch drive. One field goal as time expired.
Frequently Asked Questions
Who won the Ravens vs Bills game on September 7, 2025?
Buffalo won 41-40 on a last-second field goal by Matt Prater.
How many yards did Josh Allen have?
Allen threw for 394 yards and ran for 30 yards, totaling 424 yards and 4 touchdowns.
What was the final score of Ravens vs Bills Week 1?
Buffalo 41, Baltimore 40.
How many rushing yards did Derrick Henry have?
Henry rushed for 169 yards and 2 touchdowns on 18 carries.
Who forced the fumble that changed the game?
Ed Oliver forced Derrick Henry’s fumble with 3:06 remaining. Terrel Bernard recovered at Baltimore’s 30-yard line.
How many points did Buffalo score in the fourth quarter?
Buffalo scored 22 points in the fourth quarter, including 16 in the final 3:06.
Has any team come back from 15 points down with 4 minutes left before?
No. Buffalo was the first team in NFL history to win when trailing by 15+ points with 4 minutes remaining.
Advanced Metrics Breakdown
Baltimore’s offense was historically efficient. They averaged 0.297 EPA (Expected Points Added) per play compared to Buffalo’s 0.077. That’s a massive gap in per-play effectiveness.
Ravens’ Rushing Dominance
Baltimore generated 10 explosive runs of 10+ yards. Buffalo had one. Those 10 explosive runs accounted for 224 yards. Ravens runners averaged 3.1 yards before contact and 5.4 yards after contact, showing both good blocking and exceptional elusiveness.
Henry averaged 9.7 yards per carry on 18 attempts. Jackson averaged 11.8 yards per carry on six attempts. Those numbers are unsustainable over a full season but showed complete offensive control for 57 minutes.
Buffalo’s Pass Protection Struggles
Buffalo’s offensive line allowed 18 total pressures on 53 pass blocking snaps (34% pressure rate). Baltimore allowed just 9 pressures on 22 pass blocking snaps (41% pressure rate but far fewer dropbacks).
O’Cyrus Torrence struggled most for Buffalo, allowing 5 pressures on 53 pass blocking snaps (9.4% pressure rate). Dion Dawkins allowed 2 pressures including the sack. For Baltimore, Daniel Faalele allowed 2 pressures including a sack on 22 pass blocking snaps.
Nnamdi Madubuike dominated with 5 total pressures (1 sack, 4 hurries) on 35 pass rush snaps, a 14.3% pressure rate. Ed Oliver countered with 3 pressures on 17 pass rush snaps (17.6% pressure rate) plus the forced fumble.
Coverage Breakdowns
Baltimore’s secondary faced 44 targets. Jaire Alexander allowed all 3 completions for 83 yards (118.8 passer rating). Nate Wiggins allowed 6 of 7 targets for 78 yards (113.1 rating). The Ravens couldn’t get off the field on third down when it mattered.
Buffalo’s Taylor Rapp allowed all 4 targets for 72 yards (118.8 rating). Christian Benford allowed 4 of 5 for 61 yards (157.1 rating). But Buffalo got just enough pressure to force Jackson into difficult situations late.
PFF Grades
Ed Oliver earned a 92.3 PFF grade, the highest defensive grade in the game. Kyle Hamilton posted 91.7 for Baltimore. Josh Allen graded at 87.0 despite the comeback heroics.
Analysis: Why Buffalo Won
Buffalo ran 78 offensive plays to Baltimore’s 50. That created 56% more opportunities to score. Baltimore’s efficiency advantage (0.297 EPA per play vs 0.077) kept them ahead for 57 minutes. But when Henry fumbled, volume beat efficiency.
The red zone conversion gap was decisive. Buffalo scored on all seven red zone trips (5 TDs, 2 FGs, 100% scoring rate). Baltimore converted just one of three (33% scoring rate), settling for field goals on two trips inside the 20.
Buffalo’s offensive line struggled with pass protection (18 pressures allowed). But they gave Allen enough time on the final drive when it counted most. Baltimore’s pass rush couldn’t generate consistent pressure despite Madubuike’s dominance.
Allen avoided turnovers while Jackson was equally careful. The game came down to Henry’s fumble. One mistake erased 57 minutes in which Baltimore averaged nearly 9 yards per play.
Season Implications
Buffalo extended their home winning streak to 12 games and started 1-0 for the first time since 2020. Their 16 points in the final 3:06 matched their fastest fourth-quarter scoring burst in franchise history. Allen’s 77th career win tied him with Joe Ferguson for second all-time in Bills history.
Baltimore started 0-1 and couldn’t recover momentum. They fell to 1-3 through September, their worst four-game stretch since 2015. Harbaugh’s teams have now lost 8 games when leading by 8+ points in the fourth quarter since taking over in 2008. No other coach since 2000 has more than 6 such losses.
The turnover differential decided everything. Baltimore’s 0.297 EPA per play advantage meant nothing after Henry’s fumble. Buffalo’s +1 turnover margin translated directly to victory. Teams that win the turnover battle win 79% of NFL games. This was textbook proof.
Allen’s performance validated his MVP credentials seven months after the AFC Championship loss to Kansas City. His ability to maintain composure while trailing by 15 with under four minutes showed growth from previous playoff exits.
Henry’s fumble overshadowed his 175 yards and two touchdowns. The play revealed Baltimore’s season-long pattern: offensive dominance followed by critical fourth-quarter mistakes. Buffalo capitalized. Elite teams force mistakes. Championship teams don’t make them.